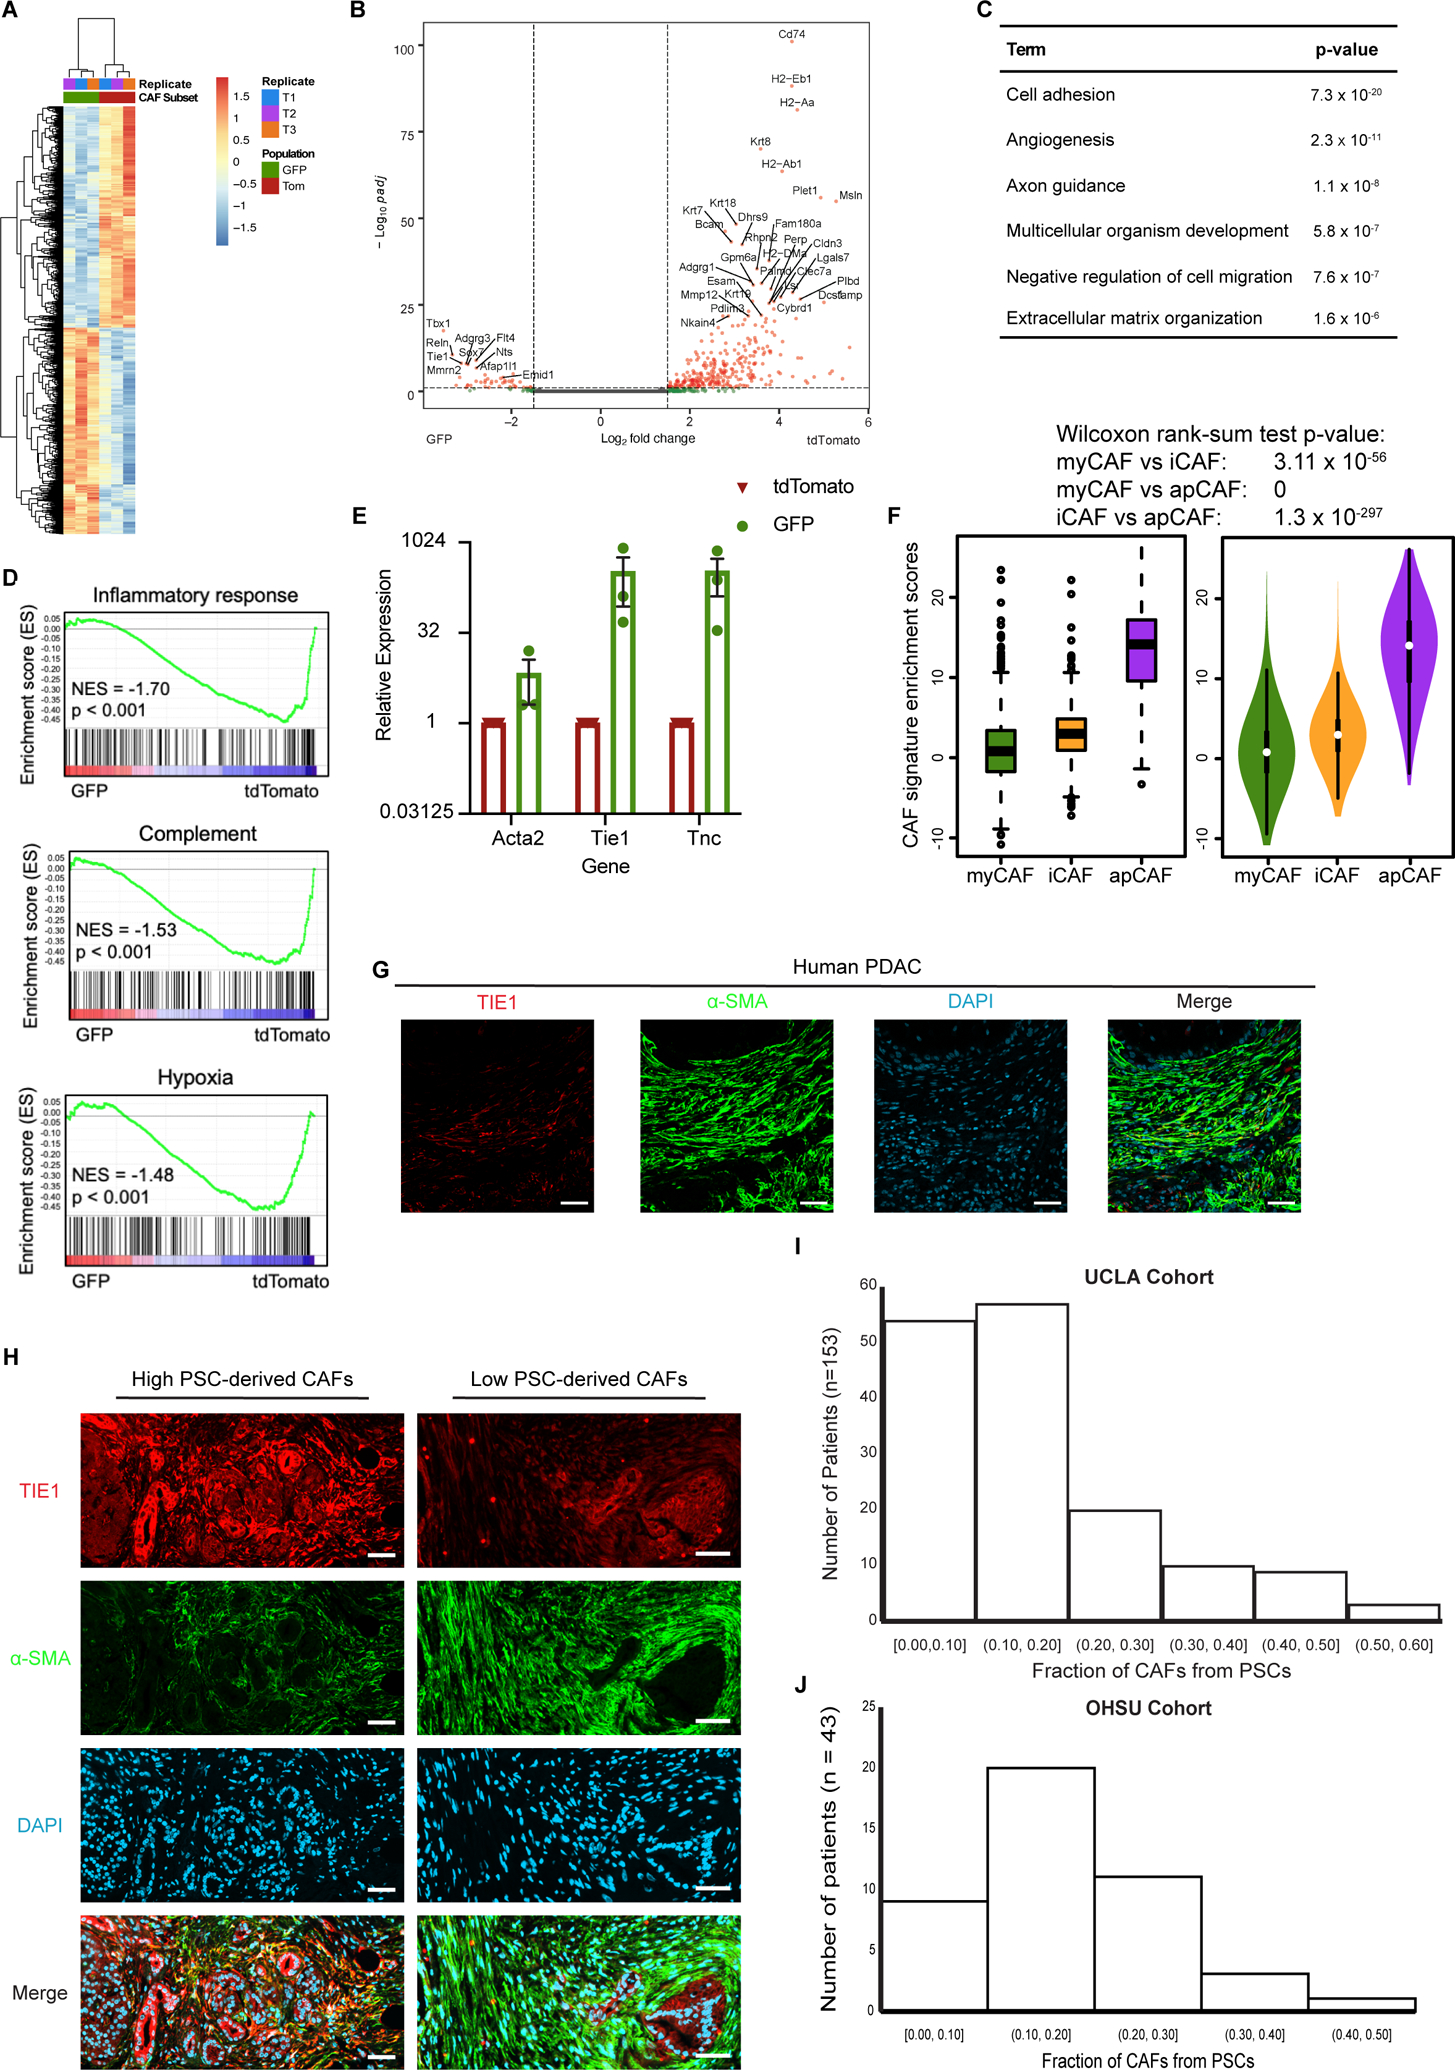
Figure 3. Mesenchymal lineage heterogeneity gives rise to transcriptional heterogeneity among PDAC CAFs.

(A) Heatmap and (B) volcano plot depicting differentially expressed genes in PSC-derived (GFP+) versus non-PSC-derived (tdTomato+) CAFs from KPC FC1199 PDAC in Fabp4-Cre;Rosa26mTmG hosts (n = 3), identified by RNA-seq. In B, gray circles indicate genes not different between the populations, green circles indicate genes with log2Fold change > 1 or < −1, and pink circles indicate genes with the same log2Fold change criteria and p < 0.05. (C) Gene ontology analysis identifying the top terms enriched in association with genes upregulated at least 2-fold in PSC-derived CAFs compared to non-PSC-derived CAFs. (D) Gene set enrichment analysis showing pathways or processes with transcriptional signatures enriched in the tdTomato+ CAF population. (E) qPCR for the indicated genes on PSC-derived and non-PSC-derived CAFs sorted from KPC FC1199 PDAC in Fabp4-Cre;Rosa26mTmG hosts (n = 3) by FACS. Data were normalized to 36b4 and are presented as mean ± SEM. (F) Box (left) and violin (right) plots indicating enrichment scores for differentially expressed genes between GFP+ and tdTomato+ CAFs among myCAF-, iCAF, and apCAF-associated genes per previously published sc-RNA-seq results. (G) Representative immunohistochemical staining of human PDAC for TIE1 and α-SMA (n = 5). Scale bar = 50 μm. (H) Representative images from a human PDAC microarray after immunohistochemical staining for TIE1 and α-SMA (n = 153). (I) Quantification of TIE1+α-SMA+ area out of total α-SMA+ area on each patient sample from the array. Different regions from the same patient were averaged together to yield one frequency per patient sample (4 punches per patient, 612 total tumor regions analyzed, 153 plotted here after averaging for each patient). (J) Quantification of TIE1+α-SMA+ area out of total α-SMA+ area using whole PDAC tissue sections (n = 43) from an independent patient cohort from that depicted in E & F.
