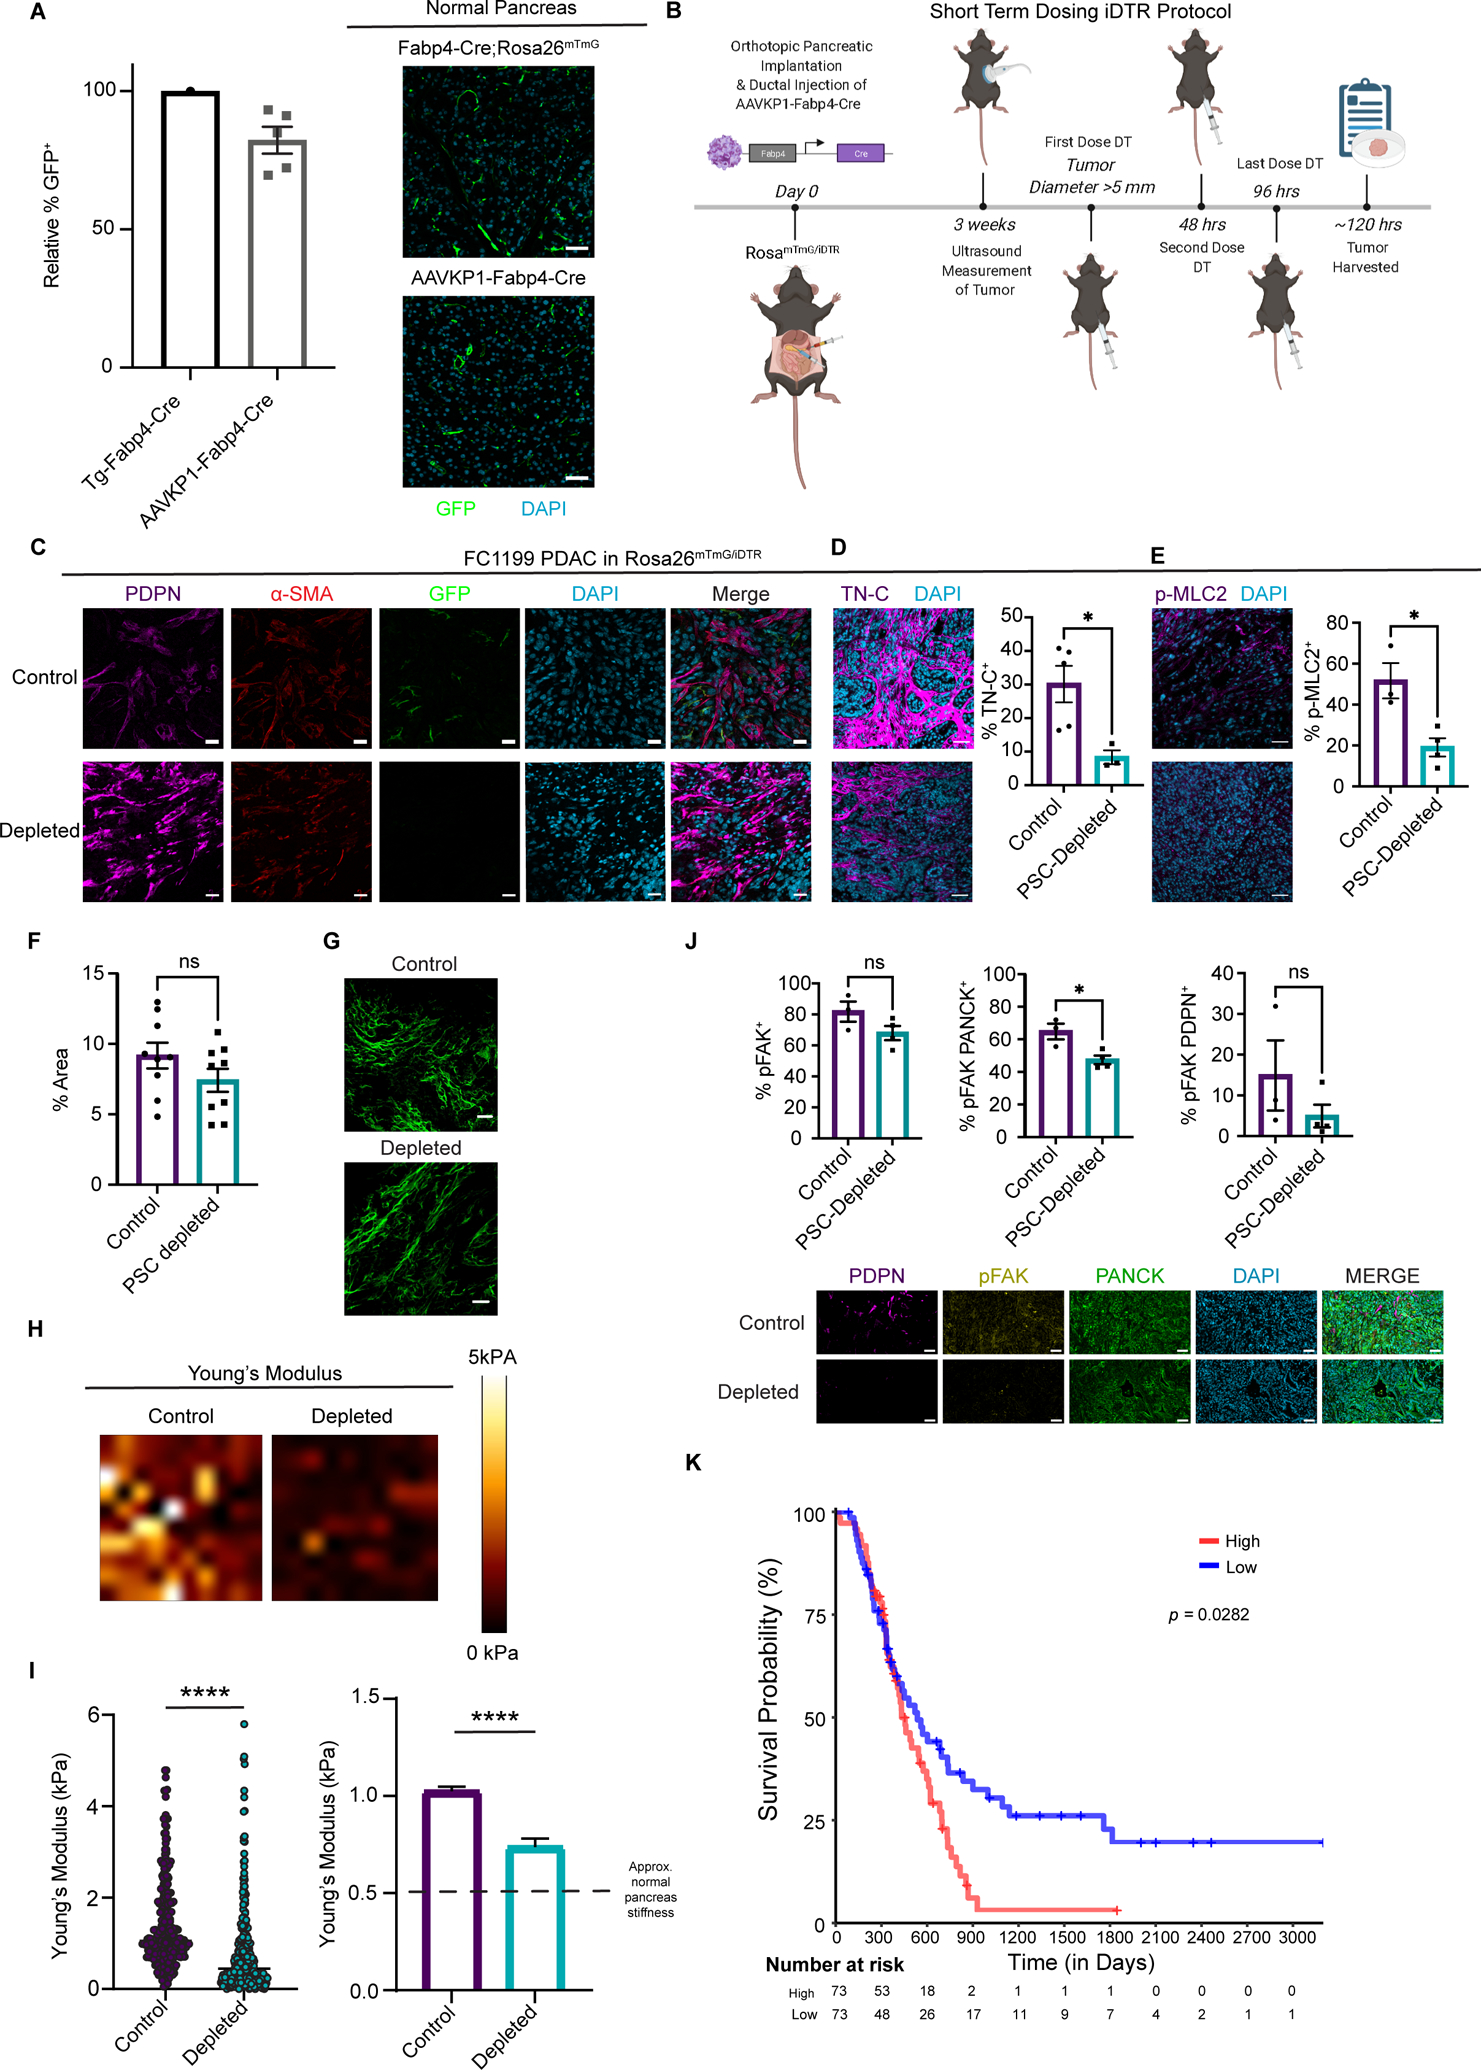
Figure 4. Targeted ablation reveals unique roles for PSC-derived CAFs in regulation of the extracellular matrix and mechanosignaling.

(A) Immunohistochemical staining and quantification of GFP+ cells in normal pancreas tissue from Fabp4-Cre;Rosa26mTmG mice and from Rosa26mTmG/iDTR mice 7 days after intraductal injection with AAVKP1-Fabp4-Cre (n = 5). Data are presented as mean ± SEM. Scale bar = 50 μm. (B) Schematic of tumor modeling using intraductal injection of AAVKP1-Fabp4-Cre and orthotopic transplantation of KPC PDAC cells into Rosa26mTmG/iDTR hosts. (C) Immunohistochemical staining for GFP, PDPN, and α-SMA of KPC FC1199 PDAC in Rosa26mTmG/iDTR hosts with intraductal injection of AAVKP1-Fabp4-Cre, enrolled when tumors reached 5–6 mm in diameter and treated with PBS or DT for 5 days (n = 4). Scale bar = 20 μm. (D) Immunohistochemical staining for TNC of KPC FC1199 PDAC in AAVKP1-Fabp4-Cre-injected Rosa26mTmG/iDTR hosts, enrolled at 5–6 mm in tumor diameter and treated with PBS or DT for 5 days (n = 3). Scale bar = 50 μm. Data are presented as mean ± SEM. *p < 0.05 by unpaired t-test. (E) Immunohistochemical staining for p-MLC2 of PDAC samples as described in D. Scale bar = 50 μm. Data are presented as mean ± SEM. *p < 0.05 by unpaired t-test. (F) Quantification and (G) images of fibrillar collagen content analyzed by second harmonic generation with normalized intensity as a quantification of concentration in control and PSC-depleted PDAC (n = 3 per group). Scale bar = 42.5 μm. (H) Force maps generated by atomic force microscopy on KPC FC1199 PDAC in AAVKP1-Fabp4-Cre-injected Rosa26mTmG/iDTR hosts (n = 3 per treatment group, control: 1063 data points, depleted: 717 data points), excised after 5 days of treatment with PBS or DT. (I) Quantification of Young’s modulus per AFM measurements on control and PSC-depleted PDAC as described in F. The dashed line on the graph on the right denotes the approximate stiffness of normal murine pancreas tissue. ****p < 0.0001 by unpaired t-test. (J) Immunohistochemical staining for p-FAK (Y397) of control and PSC-depleted PDAC harvested after 5 days of depletion (n = 3). Scale bar = 50 μm. Data are presented as mean ± SEM. *p < 0.05 by unpaired t-test. (K) Kaplan-Meier plot depicting overall survival of PDAC patients with high versus low expression of a PSC-derived CAF ECM gene signature comprised of 99 genes (see Methods), plotting the upper versus lower quartile (n = 73 per arm).
