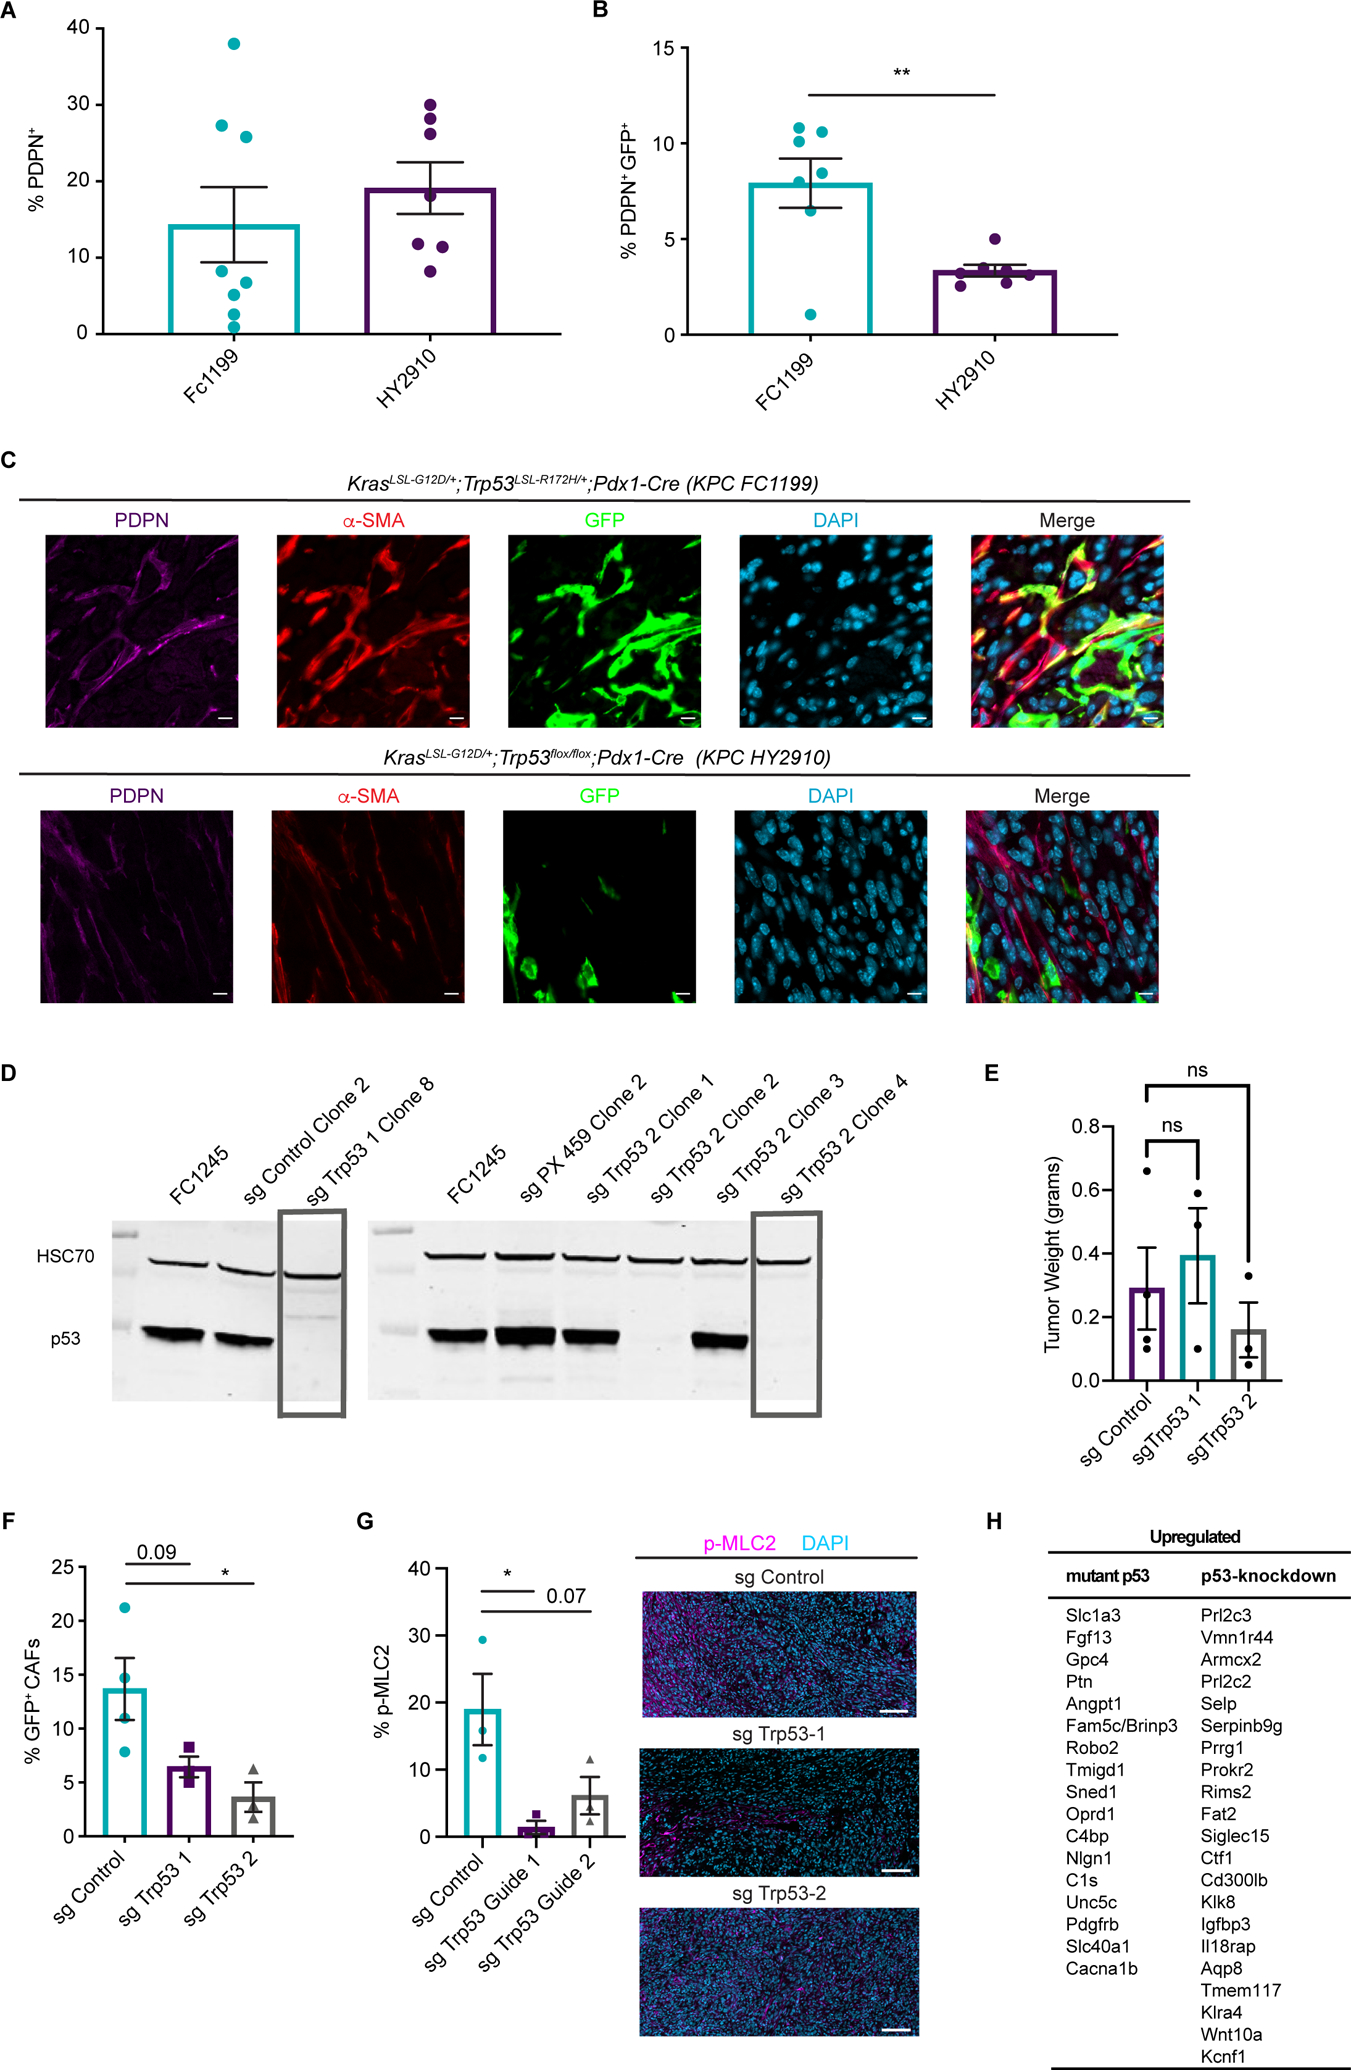
Figure 5. Tumor genotype with respect to p53 status influences stromal evolutionary routes.

(A) Flow cytometry analysis of PDPN+ cells in size-matched KPC FC1199 (p53 R172H, n = 8) and HY2910 (p53-null, n = 7) PDAC in Fabp4-Cre;Rosa26mTmG hosts. Data are presented as mean ± SEM. (B) Flow cytometry analysis of PDPN, GFP, and tdTomato in the tumors described in A to quantify the percent of CAFs derived from PSCs. Data are presented as mean ± SEM. (C) Immunohistochemical staining for GFP and PDPN on KPC FC1199 and HY2910 PDAC in Fabp4-Cre;Rosa26mTmG hosts (n = 3). Scale bar = 10 μm. (D) Western blots for p53 and HSC70 (loading control) using whole cell lysates from parental KPC FC1245 (p53 R172H) cells or derivative lines transfected with control plasmid or 1 of 2 sgTrp53 sequences. Boxes indicate clones selected for experimentation. (E) Tumor weights at experimental endpoint from control and sgTrp53 PDAC in Fabp4-Cre;Rosa26mTmG hosts. (F) Flow cytometry analysis of PDPN, GFP, and tdTomato in size-matched control (n = 4) and sgTrp53 (n = 3 per line) PDAC in Fabp4-Cre;Rosa26mTmG hosts. Data are presented as mean ± SEM. *p < 0.05 by one-way ANOVA. (G) Immunohistochemical staining for p-MLC2 in size-matched control and sgTrp53 PDAC in Fabp4-Cre;Rosa26mTmG hosts (n = 3). Scale bar = 100 μm. *p < 0.05 by one-way ANOVA. (H) List of candidate secreted factors differentially expressed in p53-mutant versus p53-null PDAC cells.
