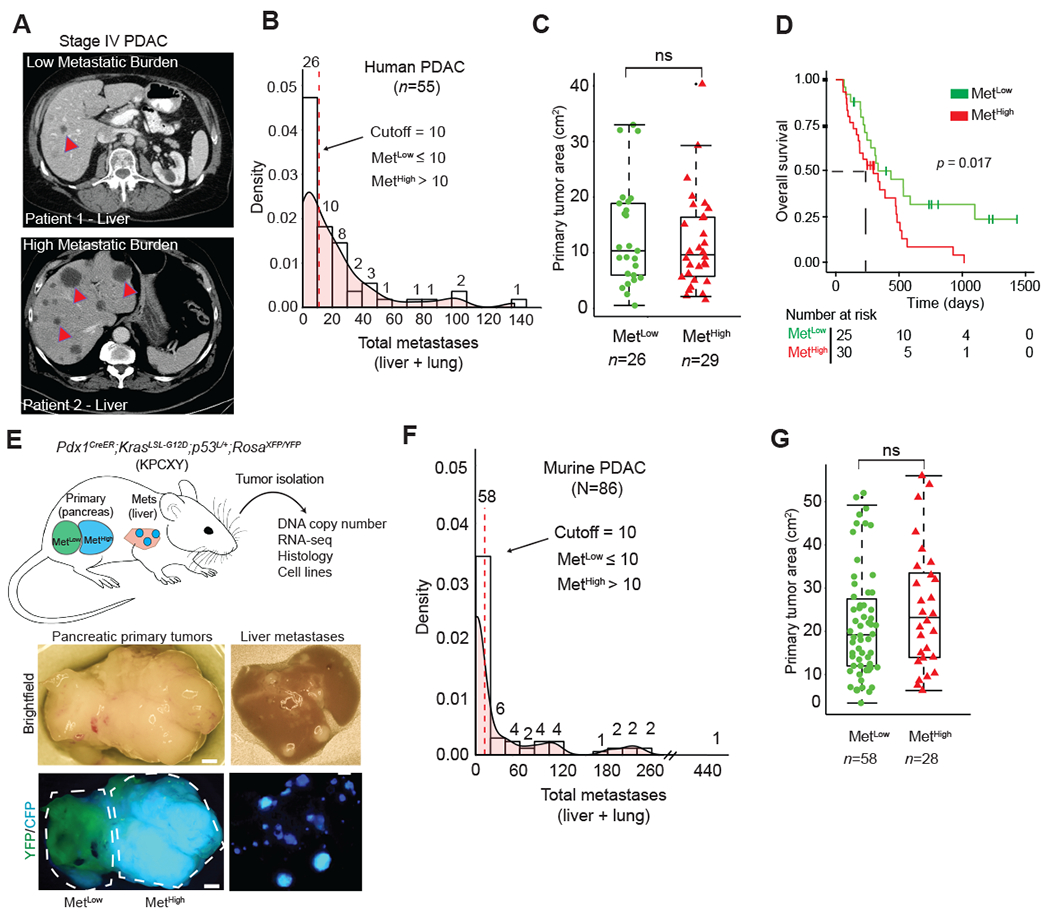
Figure 1: Advanced pancreatic tumors exhibit intertumoral differences in their propensity for metastasis.

A. CT imaging of human PDAC liver metastasis demonstrating heterogeneity in metastatic burden in Stage IV disease. Arrowheads indicate solitary metastasis in the top panel and selected metastases in the bottom panel
B. Density plot and histogram showing the distribution of total (liver and lung) metastases enumerated from CT scans of human Stage IV PDAC at the time of diagnosis (n=55). Values above each histogram bar represent the number of patients in each group. The vertical dotted line (red) represents the cutoff between MetLow tumors (≤ 10 mets) and MetHigh tumors (>10 mets) determined by k-means clustering.
C. Quantification of tumor area (based on tumor dimensions from largest cross-sectional plane on imaging) comparing MetLow and MetHigh cases from the cohort in (b).
D. Overall survival analysis of the cohort in (B).
E. Top: Schematic view of the KPCXY model, showing multiple primary tumors distinguishable by color arising in the pancreas with matched metastases in the liver. Bottom: Representative fluorescent stereomicroscopic images showing a YFP+ tumor adjoining a CFP+ tumor in the pancreas (left) and liver metastases derived from the CFP+ tumor in the same animal (right).
F. Density plot and histogram showing the distribution of total (liver and lung) metastases enumerated at autopsy of KPCXY mice. Values above each histogram bar represent the number of tumors giving rise to the indicated number of metastases, based on color (n=85 tumors from 30 KPCXY mice). The vertical dotted line (red) represents the cutoff between MetLow tumors (≤ 10 mets, n=58) and MetHigh tumors (>10 mets, n=28) determined by k-means clustering.
G. Quantification of tumor area comparing MetLow and MetHigh tumors from the cohort in (F).
Statistical analysis by Student’s unpaired t-test with p-values indicated (ns, not significant). Box-whisker plots in (C) and (F) indicate mean and interquartile range. Scale bar (E) = 1mm.
