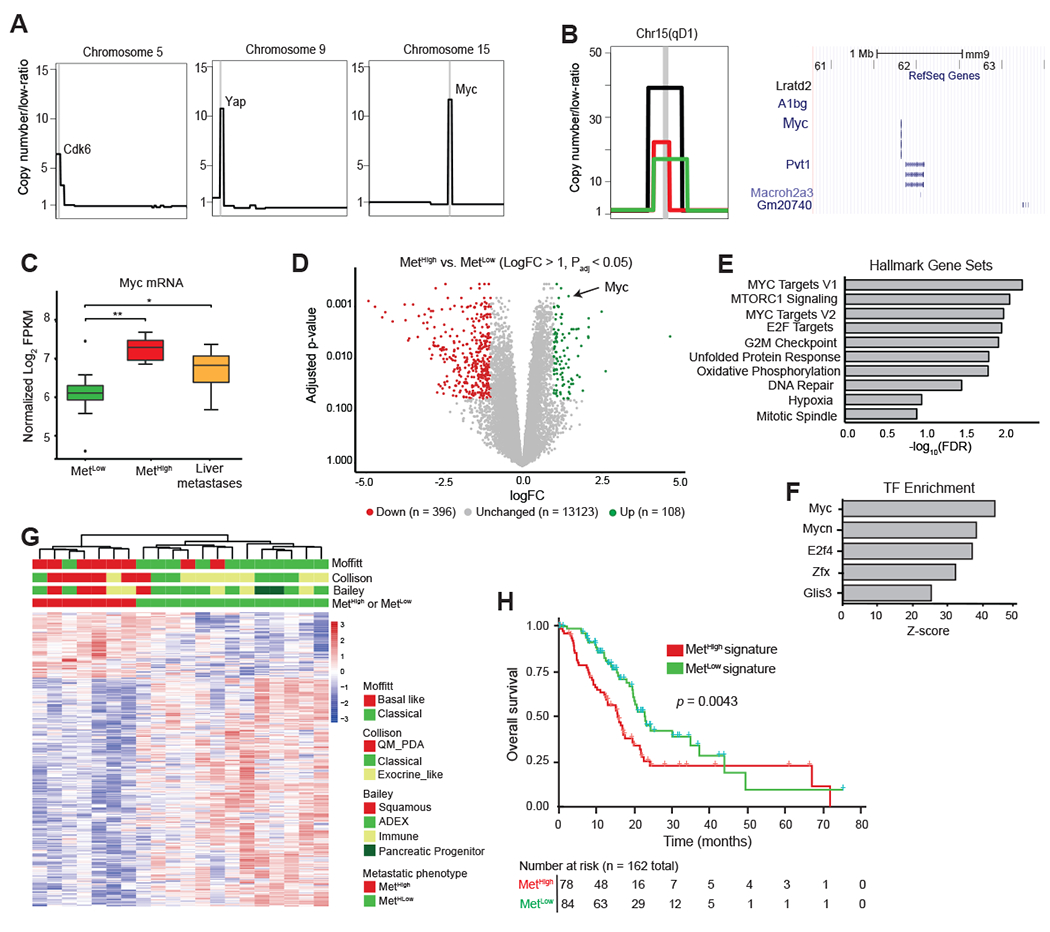
Figure 3: The MetHigh phenotype is associated with focal, high amplitude Myc amplifications and elevated expression.

A. Schematic representation of focal amplifications identified in profiled primary tumors. Vertical gray line denotes the location of amplicon and likely driver gene.
B. (Left) Representative focal amplification containing the Myc locus on chromosome 15 of a MetHigh tumor. (Center) Zoomed in schematic representation of three identified Myc amplicons in MetHigh tumors illustrating the focal and high-amplitude nature of the event. Each event (amplicon) is illustrated by a different colored segment line. The shared amplified region between the different amplicons is denoted by the chromosomal cytoband top of panel and illustrated in a UCSC genome browser view (Right) with RefSeq Genes, including Myc, illustrated.
C. Box-and-whisker plot showing Myc mRNA levels in MetHigh tumors (n=7) and paired metastases (N=34) compared to MetLow tumors (n=13).
D. Volcano plot illustrating genes meeting cutoffs for differential expression (logfold-change >1, Padj <0.05) between MetHigh and MetLow tumors (n=20 tumors used in the comparison). Genes upregulated in MetHigh tumors are highlighted in green, and genes upregulated in MetLow tumors are highlighted in red.
E. Top ten Hallmark Gene Sets identified as enriched in MetHigh tumors compared to MetLow tumors using all differentially expressed genes (DEGs) (adj. p < 0.05).
F. Top five transcription factor binding sites enriched in DEGs in MetHigh tumors compared to MetLow tumors (adj. p< 0.05) identified by Metacore prediction software.
G. Heatmap showing unsupervised clustering of differentially expressed genes (logfold-change >1, Padj <0.05) between MetHigh and MetLow tumors (n=20) and their association with PDAC transcriptional subtypes previously reported by Collison (42), Moffitt (15), and Bailey (16).
H. Kaplan-Meier analysis showing overall survival of PDAC patients in the TCGA cohort stratified into those with a MetHigh signature (red line) versus those with a MetLow signature (blue line). Signature based on DEGs with absolute logfold-change > 0.58 and Padj <0.05 (736 up and 1036 down regulated genes)
Statistical analysis in (C) was performed by Wilcoxon test (*, p=3.9x10⁻⁴; **, p=5.3x10⁻⁵). Box and whiskers represent median mRNA expression and interquartile range. Statistical analysis in (H) was performed by log-rank test.
