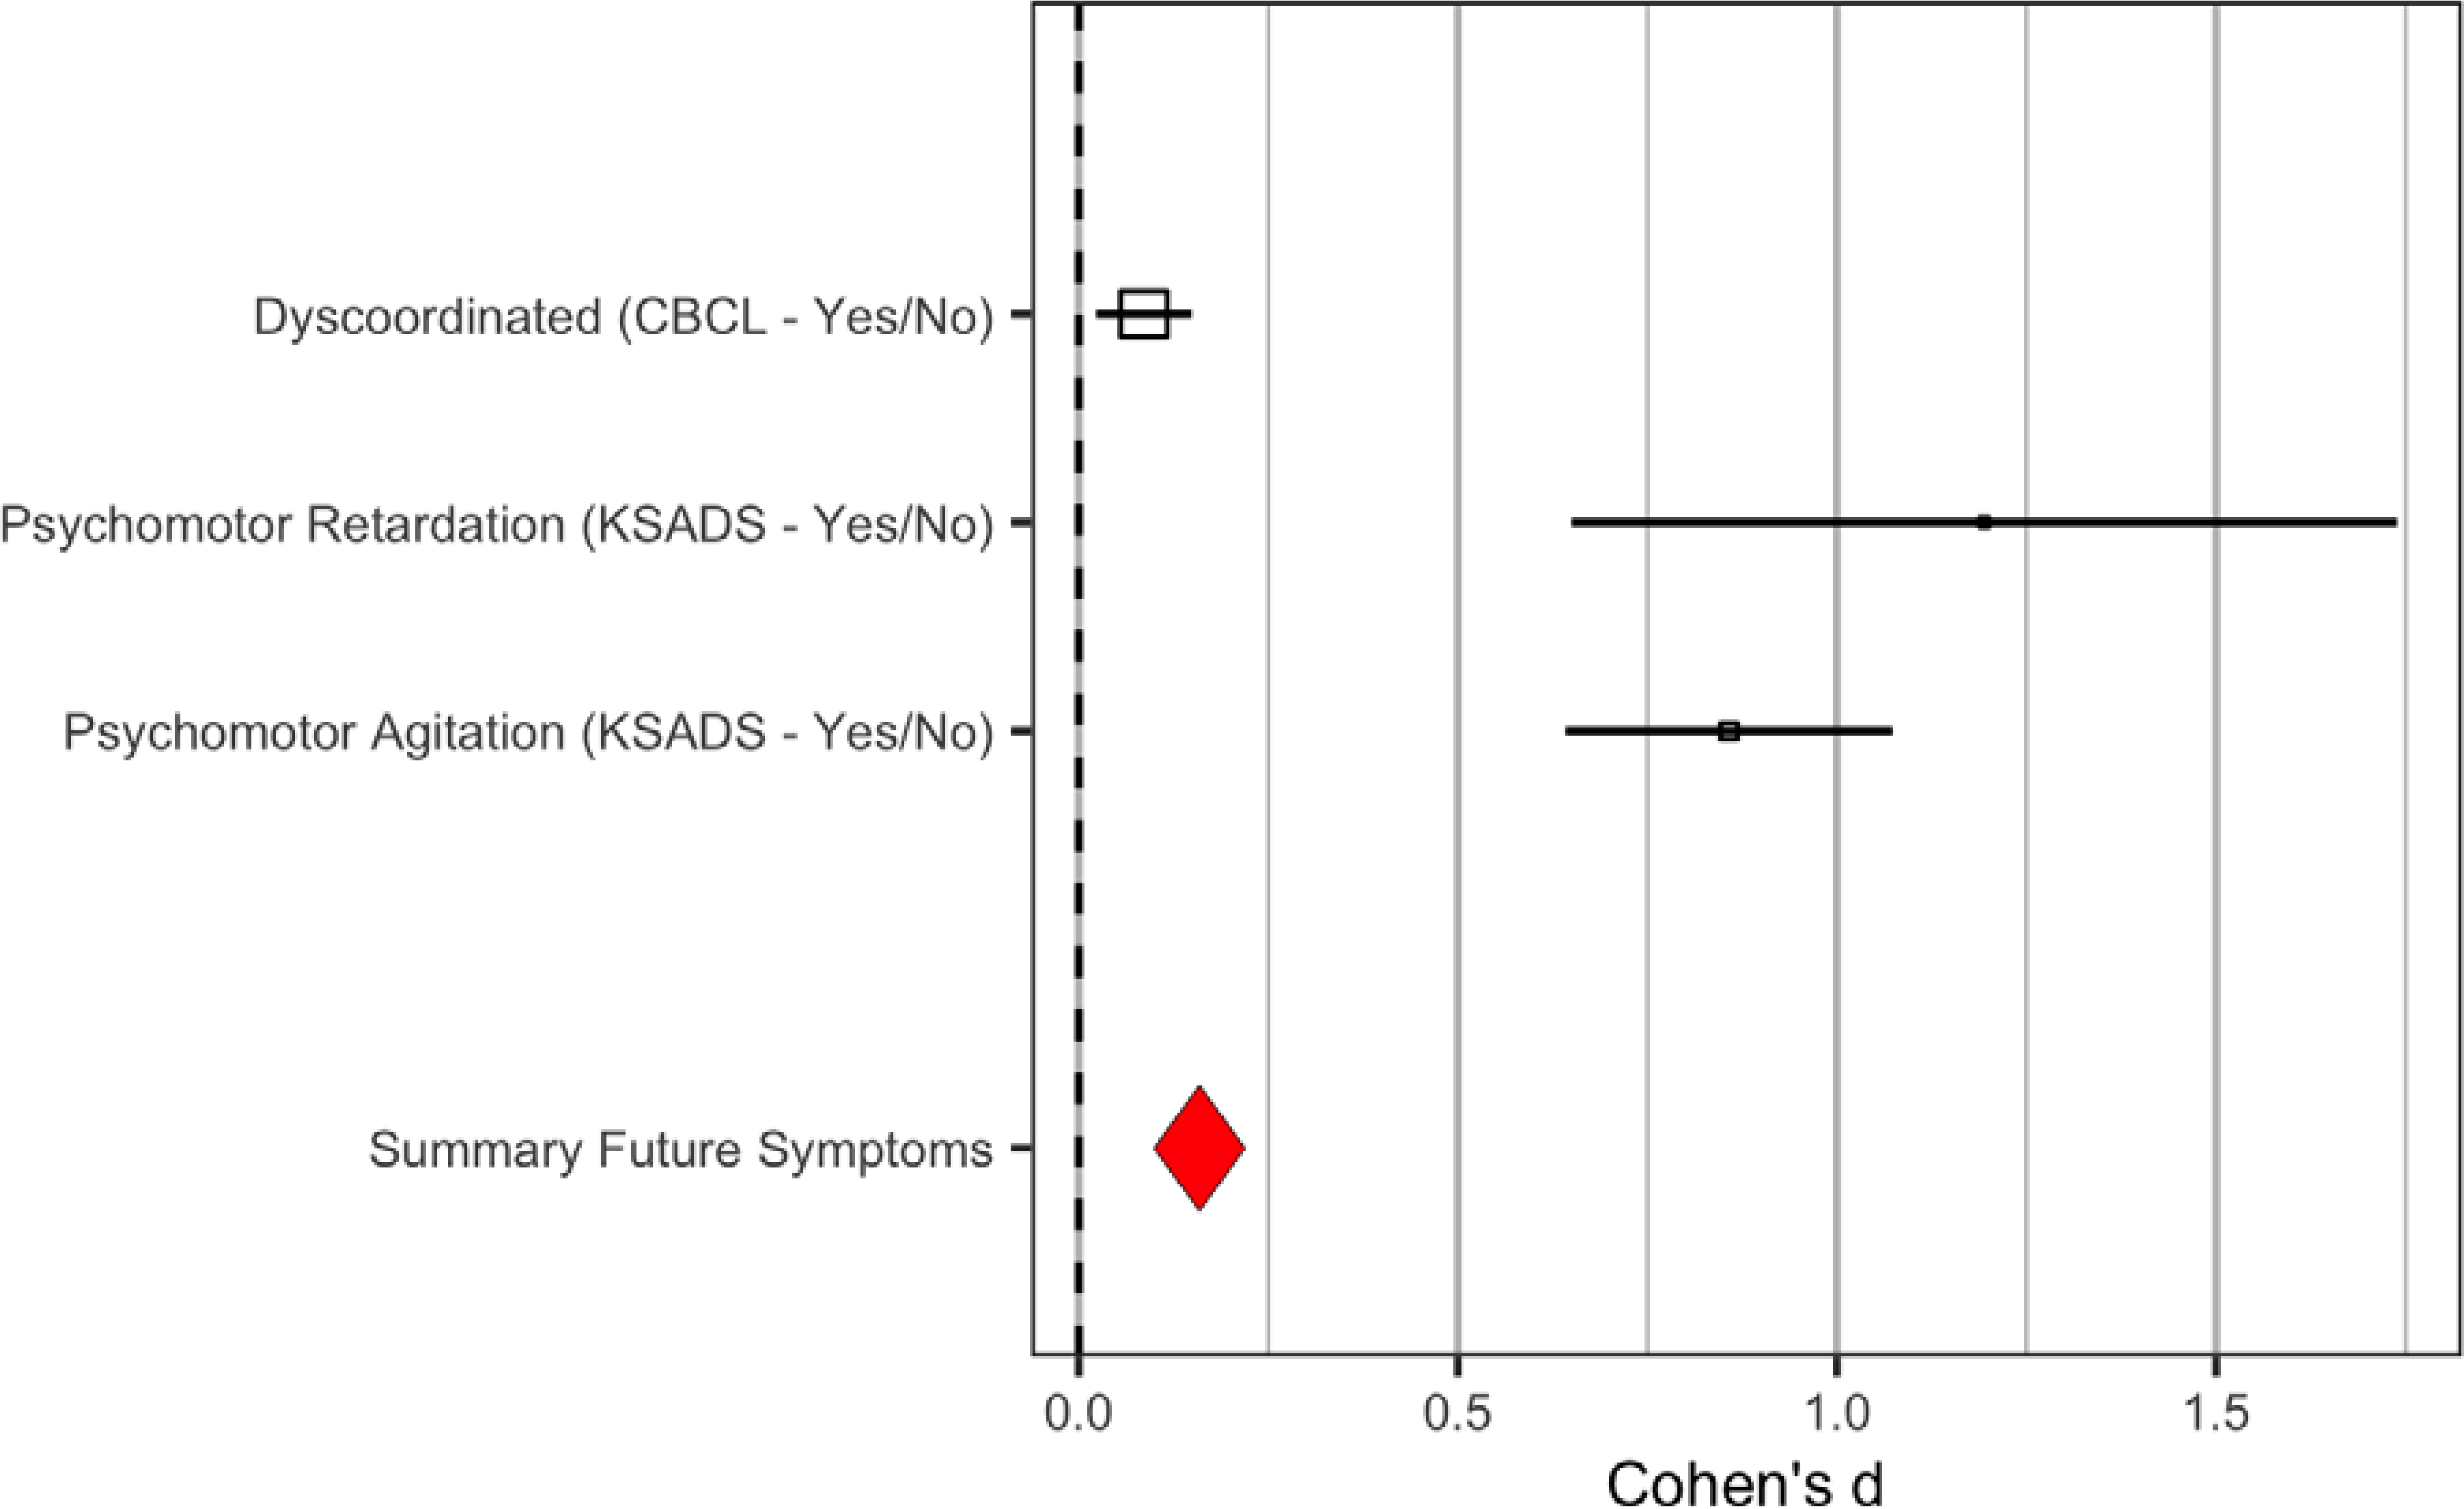
Figure 2. Effect Size of Motor Abnormalities at baseline on Depression at 1-Year Follow-Up.

Effect Sizes above are raw, not model-corrected data; Odds Ratios (see Table 2) and standard error were calculated using the Michaela package in R; Error bars reflect the standard error; Effect sizes were converted to common values using the R Michaela package [84] and visualized with the metaviz package [85].
