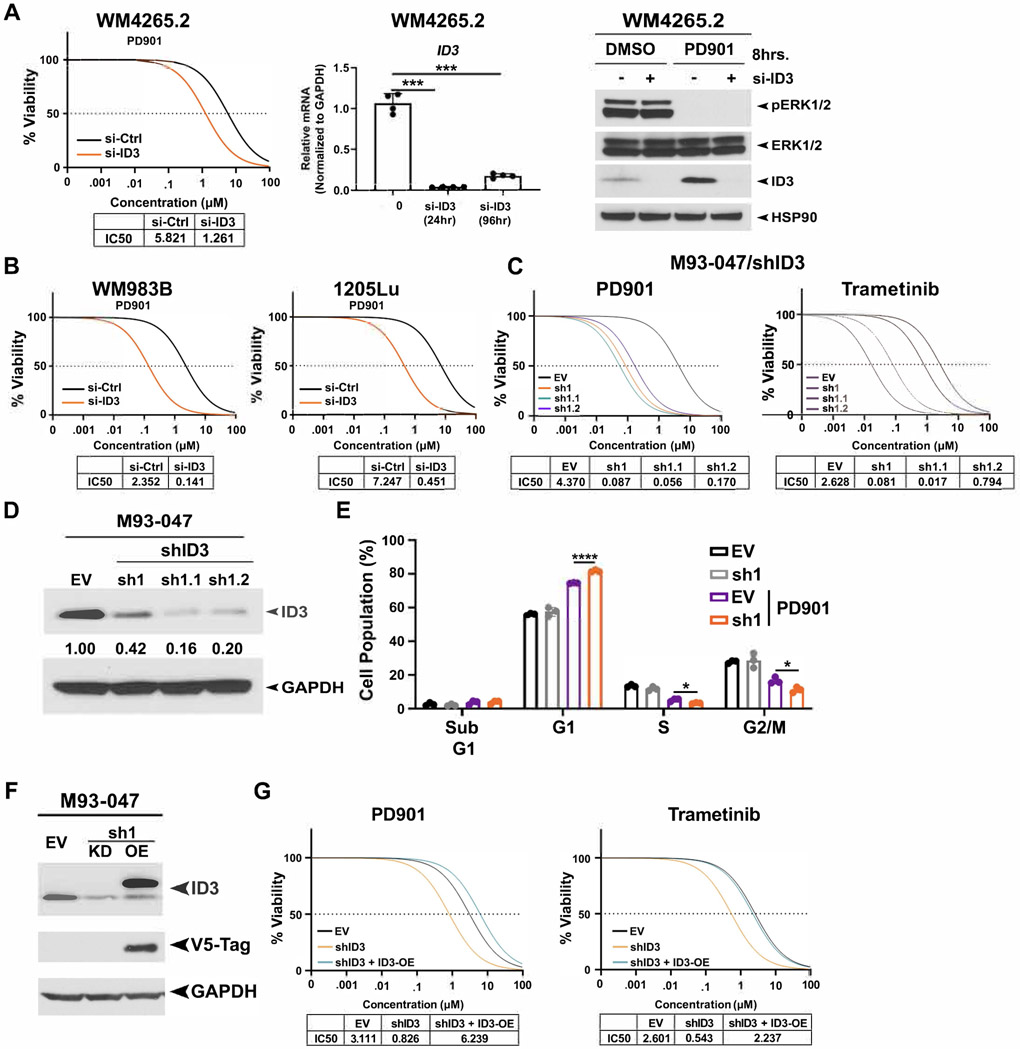
Figure 3: ID3 regulates sensitivity to MEK inhibitors.
(A) Left panel: IC50 analysis of WM4265.2 cells after incubation with siRNA targeting ID3 or non-targeting siRNA for 24 hours; cells were treated with PD901 for 72 hours and cell viability was measured using alamarBlue assays. IC50 values shown are representative of six technical replicates. Middle panel: RT-qPCR of ID3 level, normalized to GAPDH. Values shown are mean +/− standard deviation of n=3. Western blot probed with indicated antibodies of lysates from WM4265.2 cells in the presence or absence of siRNA targeting ID3 and PD901 (10μM). (B) IC50 analysis of WM983B and 1205Lu cells incubated in non-targeting siRNA or siRNA targeting ID3 and treated with PD901 for 72 hours. IC50 values shown represent n=3. (C) IC50 analysis of M93-047 cells with stable knockdown of ID3 via shRNA infection. IC50 values shown represent n=6. (D) Western blot, probed with indicated antibodies of lysates from M93-047 with pooled and two clones of shRNA targeting ID3 or empty vector (EV). (E) Cell cycle analysis of M93-047 cells with stable knockdown of ID3 or empty vector (EV) via flow cytometry. Values shown are the mean +/− standard deviation from n=3. *** p-value < 0.001, * p-value < 0.05; assessed by two tailed student’s t-test. (F) Western blot probed with indicated antibodies of lysates from M93-047 infected with empty vector (EV), shRNA for ID3 (sh1) or shRNA for ID3 plus an ID3 overexpression plasmid that is resistant to silencing (OE). (G) IC50 analysis of the M93-047 clones in F treated with PD901 or Trametinib. IC50 values shown represent n=6.

