FIGURE 7.
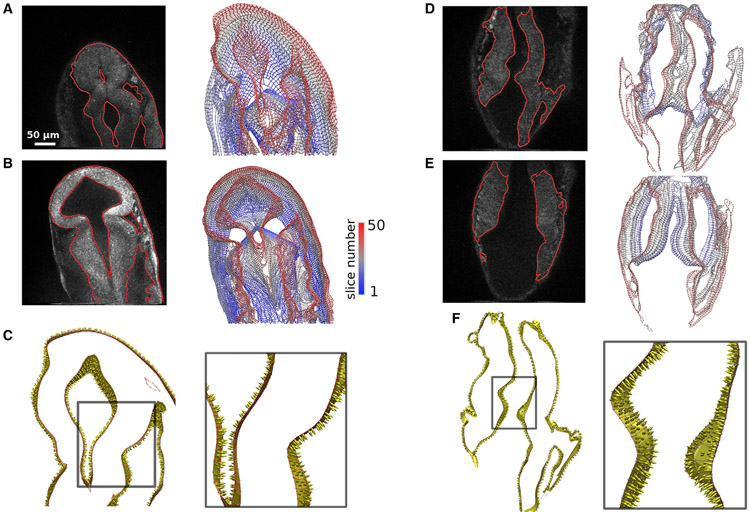
3D models of images from live zebrafish embryos. WT embryos are at 20 (A and C) and 27.5 hpf (B). Mutant ace embryos are at 20.5 (D and F) and 27.5 hpf (E). For each set, the BOC of slice 35 is overlaid on the respective autofluorescence image. Mesh color scale corresponds to slice number from dorsal to ventral planes. For ace, only slices 18–42 are shown for clarity. Surface and normal vectors are shown in yellow for slices 47–50 of the WT (C) and 35–38 of the ace embryos (F). Normal vectors (arrows) point to the outside of the neuroepithelium. Fig. S4 shows models for other time points.

