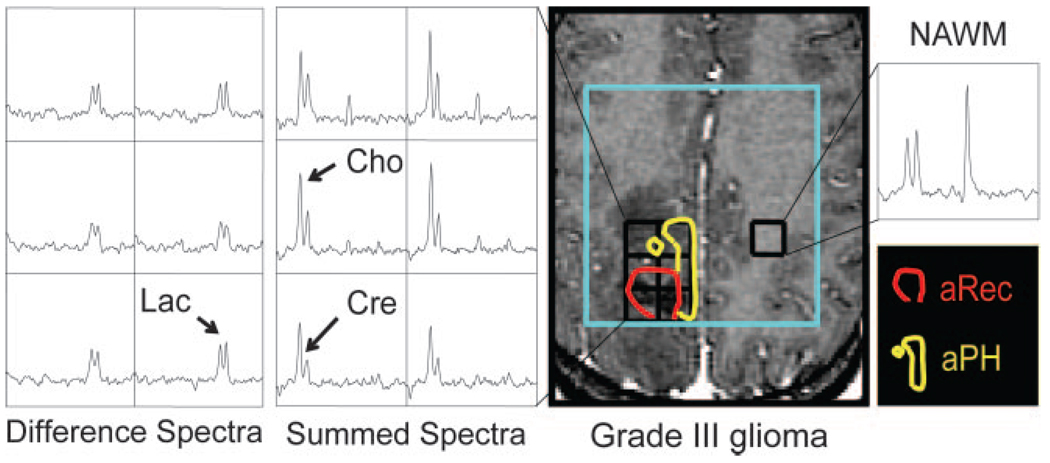
Fig 2.
Spectral patterns and regions of abnormal perfusion for a representative patient with nonenhancing grade III glioma. From the summed spectra, a clear elevation of choline (Cho), especially in the aPH region (yellow), and a reduction in creatine (Cre) levels, most notably in the aRec region (red), are observed compared with the contralateral NAWM spectra. Increased lactate (Lac) levels that persist throughout the T1-hypointense lesion are shown by the difference spectra.

