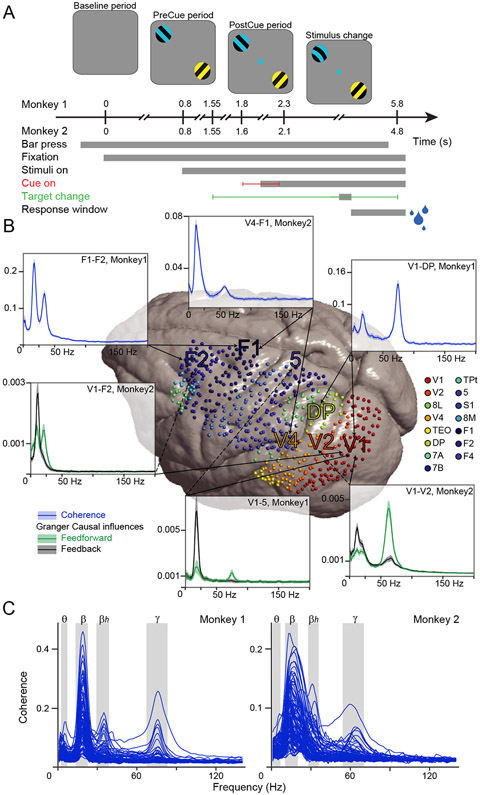
Figure 1. Stimuli, attention task, recording site distribution, FC spectra and frequency bands.
(A) Two macaque monkeys were trained to release a lever when a change occurred to the target stimulus, i.e. the stimulus with the same color as the fixation dot, while maintaining fixation and ignoring changes to the distractor stimulus, i.e. the stimulus with a different color than the fixation dot. Correct performance was rewarded with liquid reward (blue droplets). Task delays for Monkey 1 and 2 are given in seconds.
(B) Pooled recording sites of both monkeys on the surface of the INIA19 template brain (see Fig. S1A for sites per monkey). Sites are colored according to the area color legend on the right, based on the Kennedy lab nomenclature (Markov et al., 2011). V1: Primary visual cortex; V2: Secondary visual cortex; 8L: Lateral part of area 8/FEF; V4: Fourth visual area; TEO: Temporal-occipital area; DP: Dorsal prelunate area; 7A and 7B: Parts A and B of parietal area 7; TPt: temporo-parietal area (posterior auditory association cortex); 5: area 5; S1: Primary somatosensory cortex; 8M: Medial part of area 8/FEF; F1: corresponding to Primary motor cortex; F2: corresponding to the caudal part of dorsal premotor cortex; F4: corresponding to the caudal part ventral premotor cortex. Spectra show examples of interareal Coherence (in blue) and GC (green: feedforward; black: feedback, plain/dashed lines point to the cortical area sending feedforward/feedback projections). Spectra show mean over all trials ±99.9% confidence intervals from bootstrap estimates over trials.
(C) Each line is the average coherence spectrum for a pair of cortical areas, in one of the monkeys (Monkey 1: left plot; Monkey 2: right plot). With 15 simultaneously recorded cortical areas, there are 105 area pairs, hence 105 average coherence spectra per plot. Each area has been recorded with several recording sites (see Methods). Therefore, each area pair corresponds to several interareal site pairs. The spectra of site pairs belonging to a given area pair were averaged for this plot. For each of the four frequency bands, the peak frequencies (PFs) and the corresponding full width at half maximum (FWHM) are given in the Results and Methods, and the FWHMs are indicated in this figure by the gray-shaded areas.
See also Figure S1.

