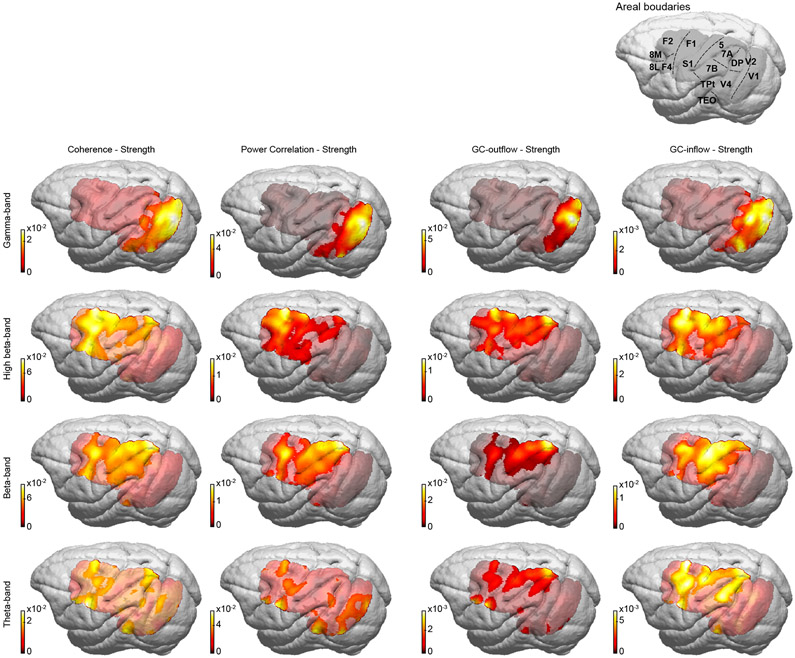
Figure 3. Topographies of FC strengths.
All panels show FC strength topographies averaged over both monkeys, with the FC type (coherence, power correlation, GC outflow, GC inflow) listed above the columns, and the frequency bands listed to the left of the rows. The strength metric, for a given FC type and frequency band, is defined per recording site, e.g. the coherence (or power-correlation) strength of a given site is the average coherence (or power correlation) of that site with all other sites; the GC outflow strength of a given site is the average GC directed from that site to all other sites; the GC inflow strength of a given site is the average GC directed to that site from all other sites. Strength topographies of the two monkeys have been coregistered to the same template brain and then averaged over monkeys. Gray masking indicates non-significant strength (comparison to a random graph with equal weight distribution; FDR-corrected for multiple comparisons over sites, see Methods). The template brain in the upper right of the figure shows the cortical area boundaries.
See also Figure S3.

