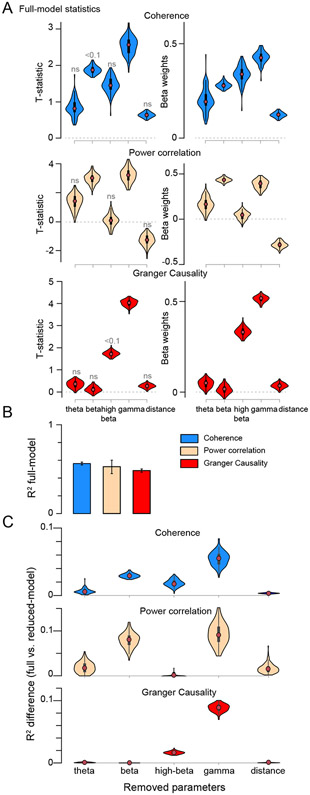
Figure 6. Multiple regression discloses distance as poor predictor of the structure-function relationship.
(A) Violin plots of model estimates (left column: t-statistic; right column: beta coefficients) for each of the five variables considered i.e. FC in the four frequency-bands and distance, separately per FC type (as indicated above each row).
(B) Total explained variance (R2) for the three models (color-legend, top-right). Mean ±99.9% confidence intervals from bootstrap estimates over trials.
(C) Difference in total explained variance of the three models (same color code as in B) between the full- and the reduced-model, after removing the parameter listed on the x-axis. This estimates the contribution of each of the five parameters to the total explained variance.

