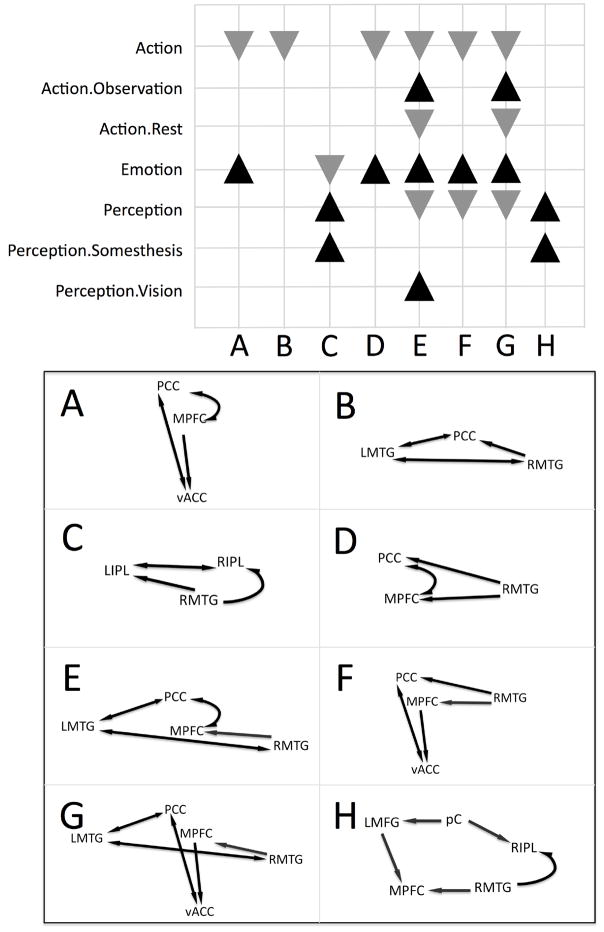
Figure 6. Behavioral Domain Profiles for DMN Sub-Networks.
Significant behavioral domains are listed for each DMN sub-network. Black upward triangles indicate clique domain counts that were higher than expected as compared across the BrainMap database, while gray downward triangles indicate lower than expected domains. A – G depicts each of the sub-networks identified in the analysis of DMN co-activations, extracted from the observed connections in Figure 5. A and B are sub-networks composed of 3 nodes, constrained by the direction of paths in the model; C and D include 3 nodes unconstrained by path direction; E includes 4 constrained nodes; F includes 4 unconstrained nodes; G includes 5 constrained nodes; and H includes 5 unconstrained nodes.

