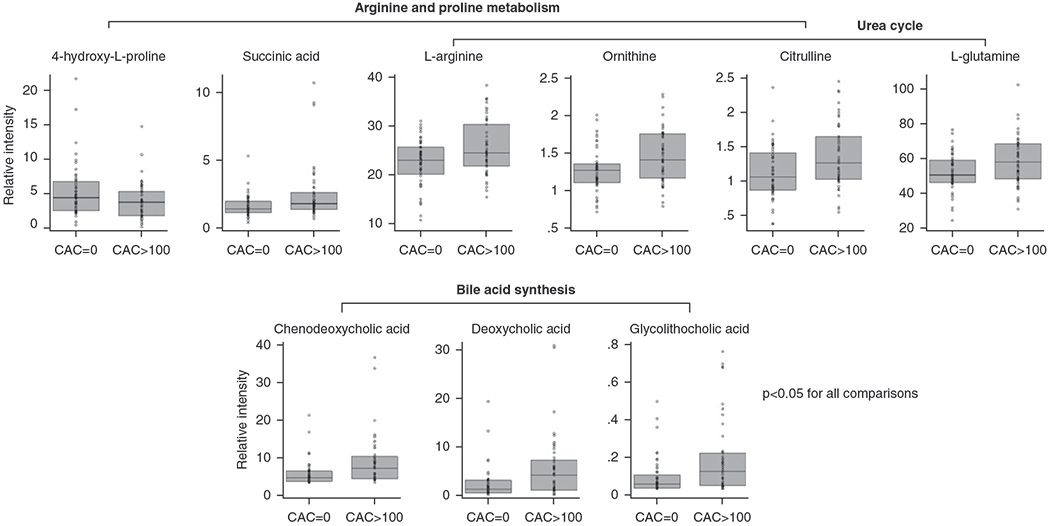
Figure 2. |. Cases and controls had different levels of selected metabolites in arginine and proline metabolism, urea cycle, and bile-acid synthesis.

Mann–Whitney U tests were used to compare metabolites between cases (CAC >100) and controls (CAC =0). Metabolites with a P value <0.05 are presented above. l-Arginine (fold difference, 1.14; P=0.03), ornithine (fold difference, 1.17; P=0.008), and citrulline (fold difference, 1.21; P=0.01) are in both arginine and proline metabolism and urea cycle. 4-Hydroxy-l-proline (fold difference, 0.74; P=0.04) and succinic acid (fold difference, 1.44; P=0.005) are only in arginine and proline metabolism, whereas l-glutamine (fold difference, 1.12; P=0.02) is only in the urea-cycle pathway. Chenodeoxycholic acid (fold difference, 2.33; P=0.002), deoxycholic acid (fold difference, 2.32; P=0.001), and glycolithocholic acid (fold difference, 2.44; P=0.004) are in the bile-acid synthesis pathway. Box plots represent median and interquartile range.
