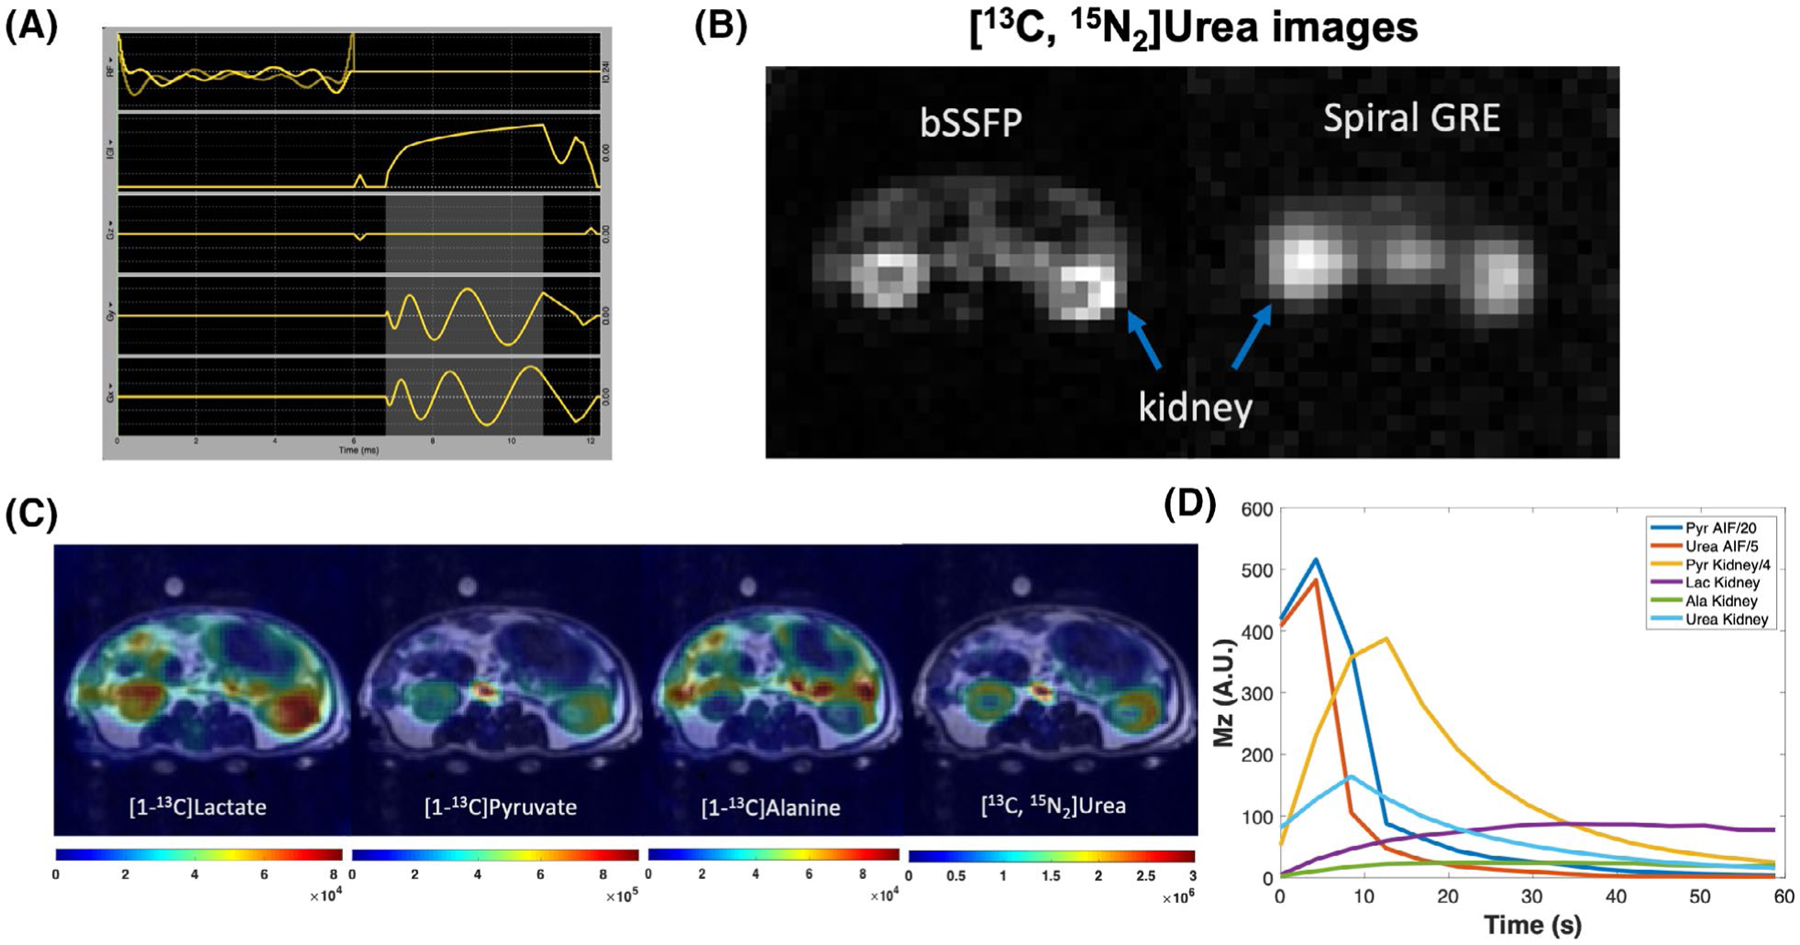
FIGURE 4.

A, A pulse sequence diagram of bSSFP sequence for HP 13C urea acquisition (highlighted area indicates readout duration). B, bSSFP sequence produced superior image quality (signal-to-noise ratio, resolution, sharpness) compared to the single-shot spiral GRE sequence. C, Representative simultaneously acquired metabolism and perfusion images of an adult rat: sum HP signals of each metabolite were overlaid on T2 weighted images; flip angels of lactate, alanine, pyruvate, and urea were 30°, 30°, 8°, 50°, with 2.5 × 2.5 × 21 mm spatial resolution and 4.2 s temporal resolution. D, HP signal dynamics in the aorta and kidneys of an adult rat
