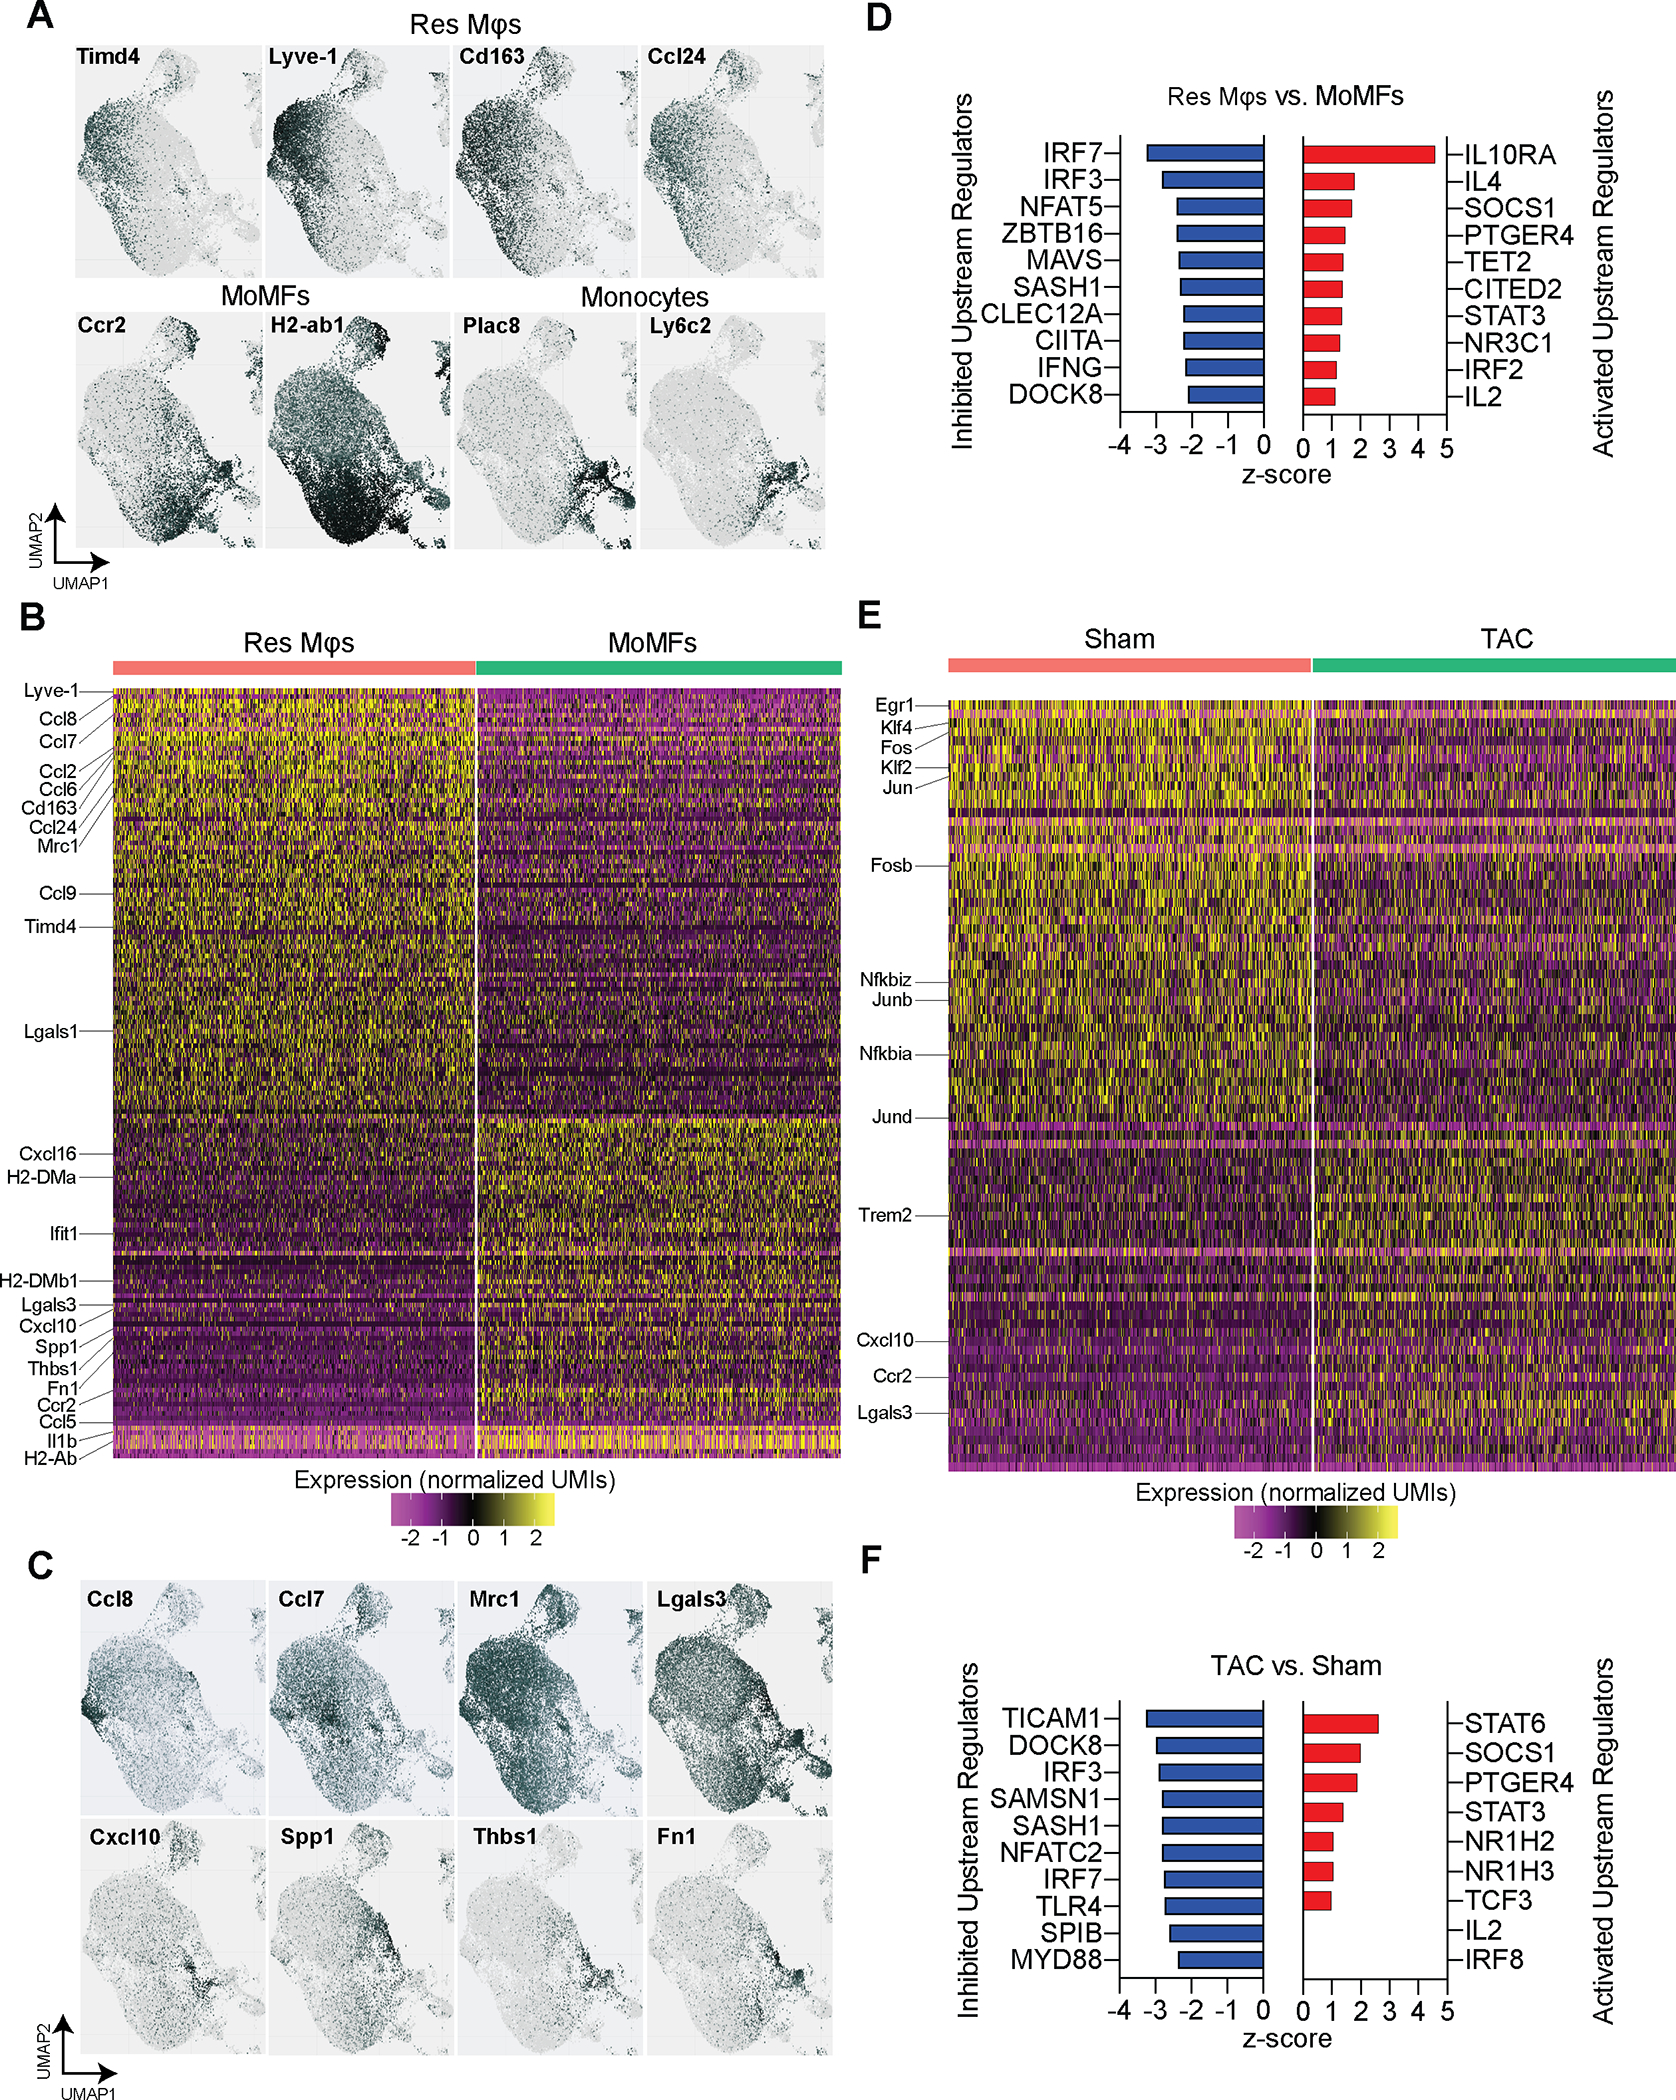
Figure 3. Analysis of cardiac macrophage gene expression patterns.

A. Identification of Res Mφs and MoMFs based on the expression of marker genes Lyve1, Timd4, Ccr2, and H2-Ab1. Additional genes that correspond with Res Mφs (Cd163 and Ccl24) or monocytes (Ly6c2 and Plac8) are shown. B. Heatmap of Differentially Expressed Genes between Res Mφs and MoMFs. Selected genes are indicated. C. Gene expression patterns of selected genes that were differentially expressed between Res Mφs and MoMFs show distinct expression patterns within mφ clusters. D. List of inhibited and activated upstream regulators identified with Ingenuity Pathway analysis from DEGs between Res Mφs and MoMFs. E. Heatmap of Differentially Expressed Genes between sham and TAC-derived cardiac mφs. Selected genes are indicated. F. List of inhibited and activated upstream regulators identified with Ingenuity Pathway analysis from DEGs between sham and TAC-derived mφs. Single-cell data is shown as scaled, variance-stabilized unique molecular identifiers (UMI) counts.
