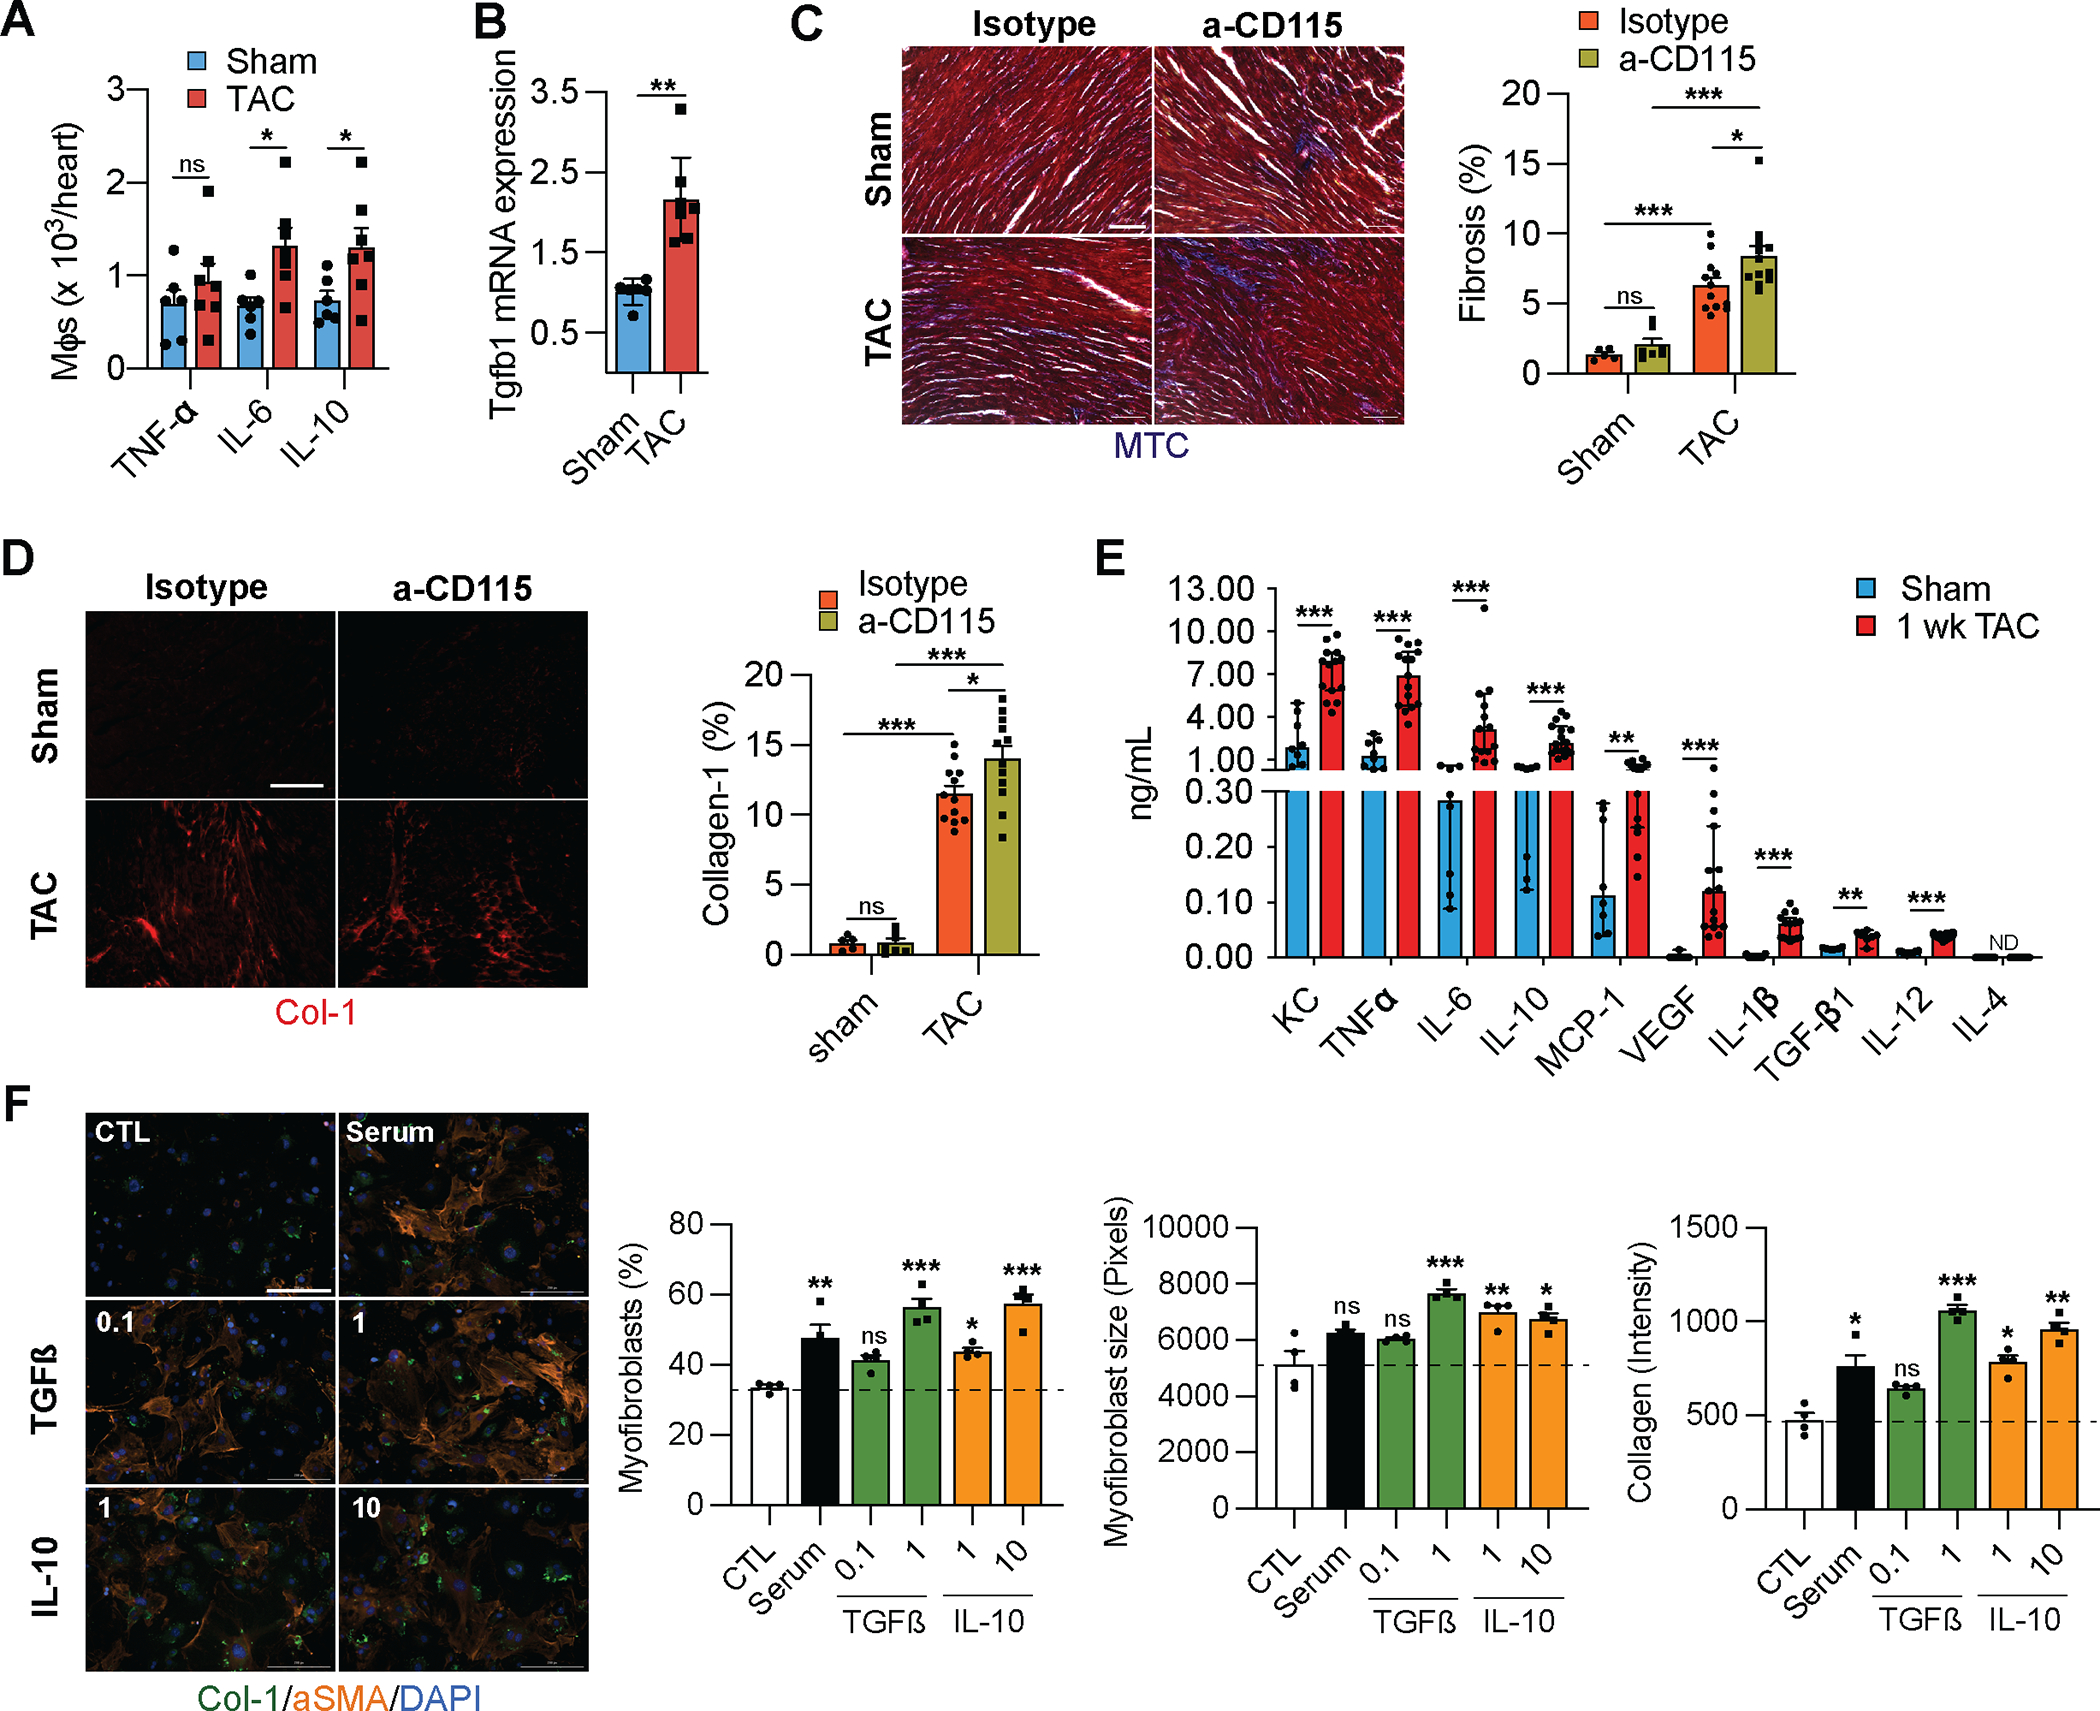
Figure 5. Cardiac macrophages regulate fibrosis.

A. Quantification of cytokine-producing mφs isolated from sham or TAC operated mice. (n=6, 7). Statistical significance by cytokine was determined by two-tailed unpaired Student’s t test. B. Taqman qPCR for Tgfb1 on cDNA from freshly isolated mφs from sham or TAC operated mice. (n=6, 7). Statistical significance was evaluated by a Kruskal-Wallis test. C. Representative images (left) of Masson’s Trichrome-stained sections derived from sham or TAC operated mice after isotype or α-CD115 antibody administration. Bar graph (right) shows quantification of fibrosis (blue staining). (n=5, 7, 12, 12). Statistical significance was evaluated by a two-way ANOVA. All pairwise comparisons were made. Tukey’s tests were used to correct for multiple comparisons. D. Representative images (left) of collagen-1-stained sections derived from sham or TAC operated mice after isotype or α-CD115 antibody administration. Bar graph (right) shows the percent of collagen-1 staining (n=5, 7, 12, 12). Statistical significance was evaluated by a two-way ANOVA. All pairwise comparisons were made. Tukey’s tests were used to correct for multiple comparisons. E. Quantification of cytokines in the supernatants from mφs isolated from sham or TAC operated mice (n=8, 15) using a Legendplex™ assay following 16 hours of culture with 10 ng/mL of LPS. Statistical significance between the sham and TAC groups by cytokine was determined by two-tailed Mann-Whitney U tests. F. Representative images of fibroblasts stained for collagen-1 (green), αSMA (orange), and DAPI (blue) following treatment with 0.1 and 10 ng/mL of TGFß or IL-10 (n=4). Bar graphs show quantification of myofibroblast percentage, myofibroblast size, and collagen-1 intensity. Statistical significance was evaluated by a Kruskal-Wallis test. All comparisons were made against the control (CTL). Dunn’s tests were used to correct for multiple comparisons. for C, D and 200μm for F.
