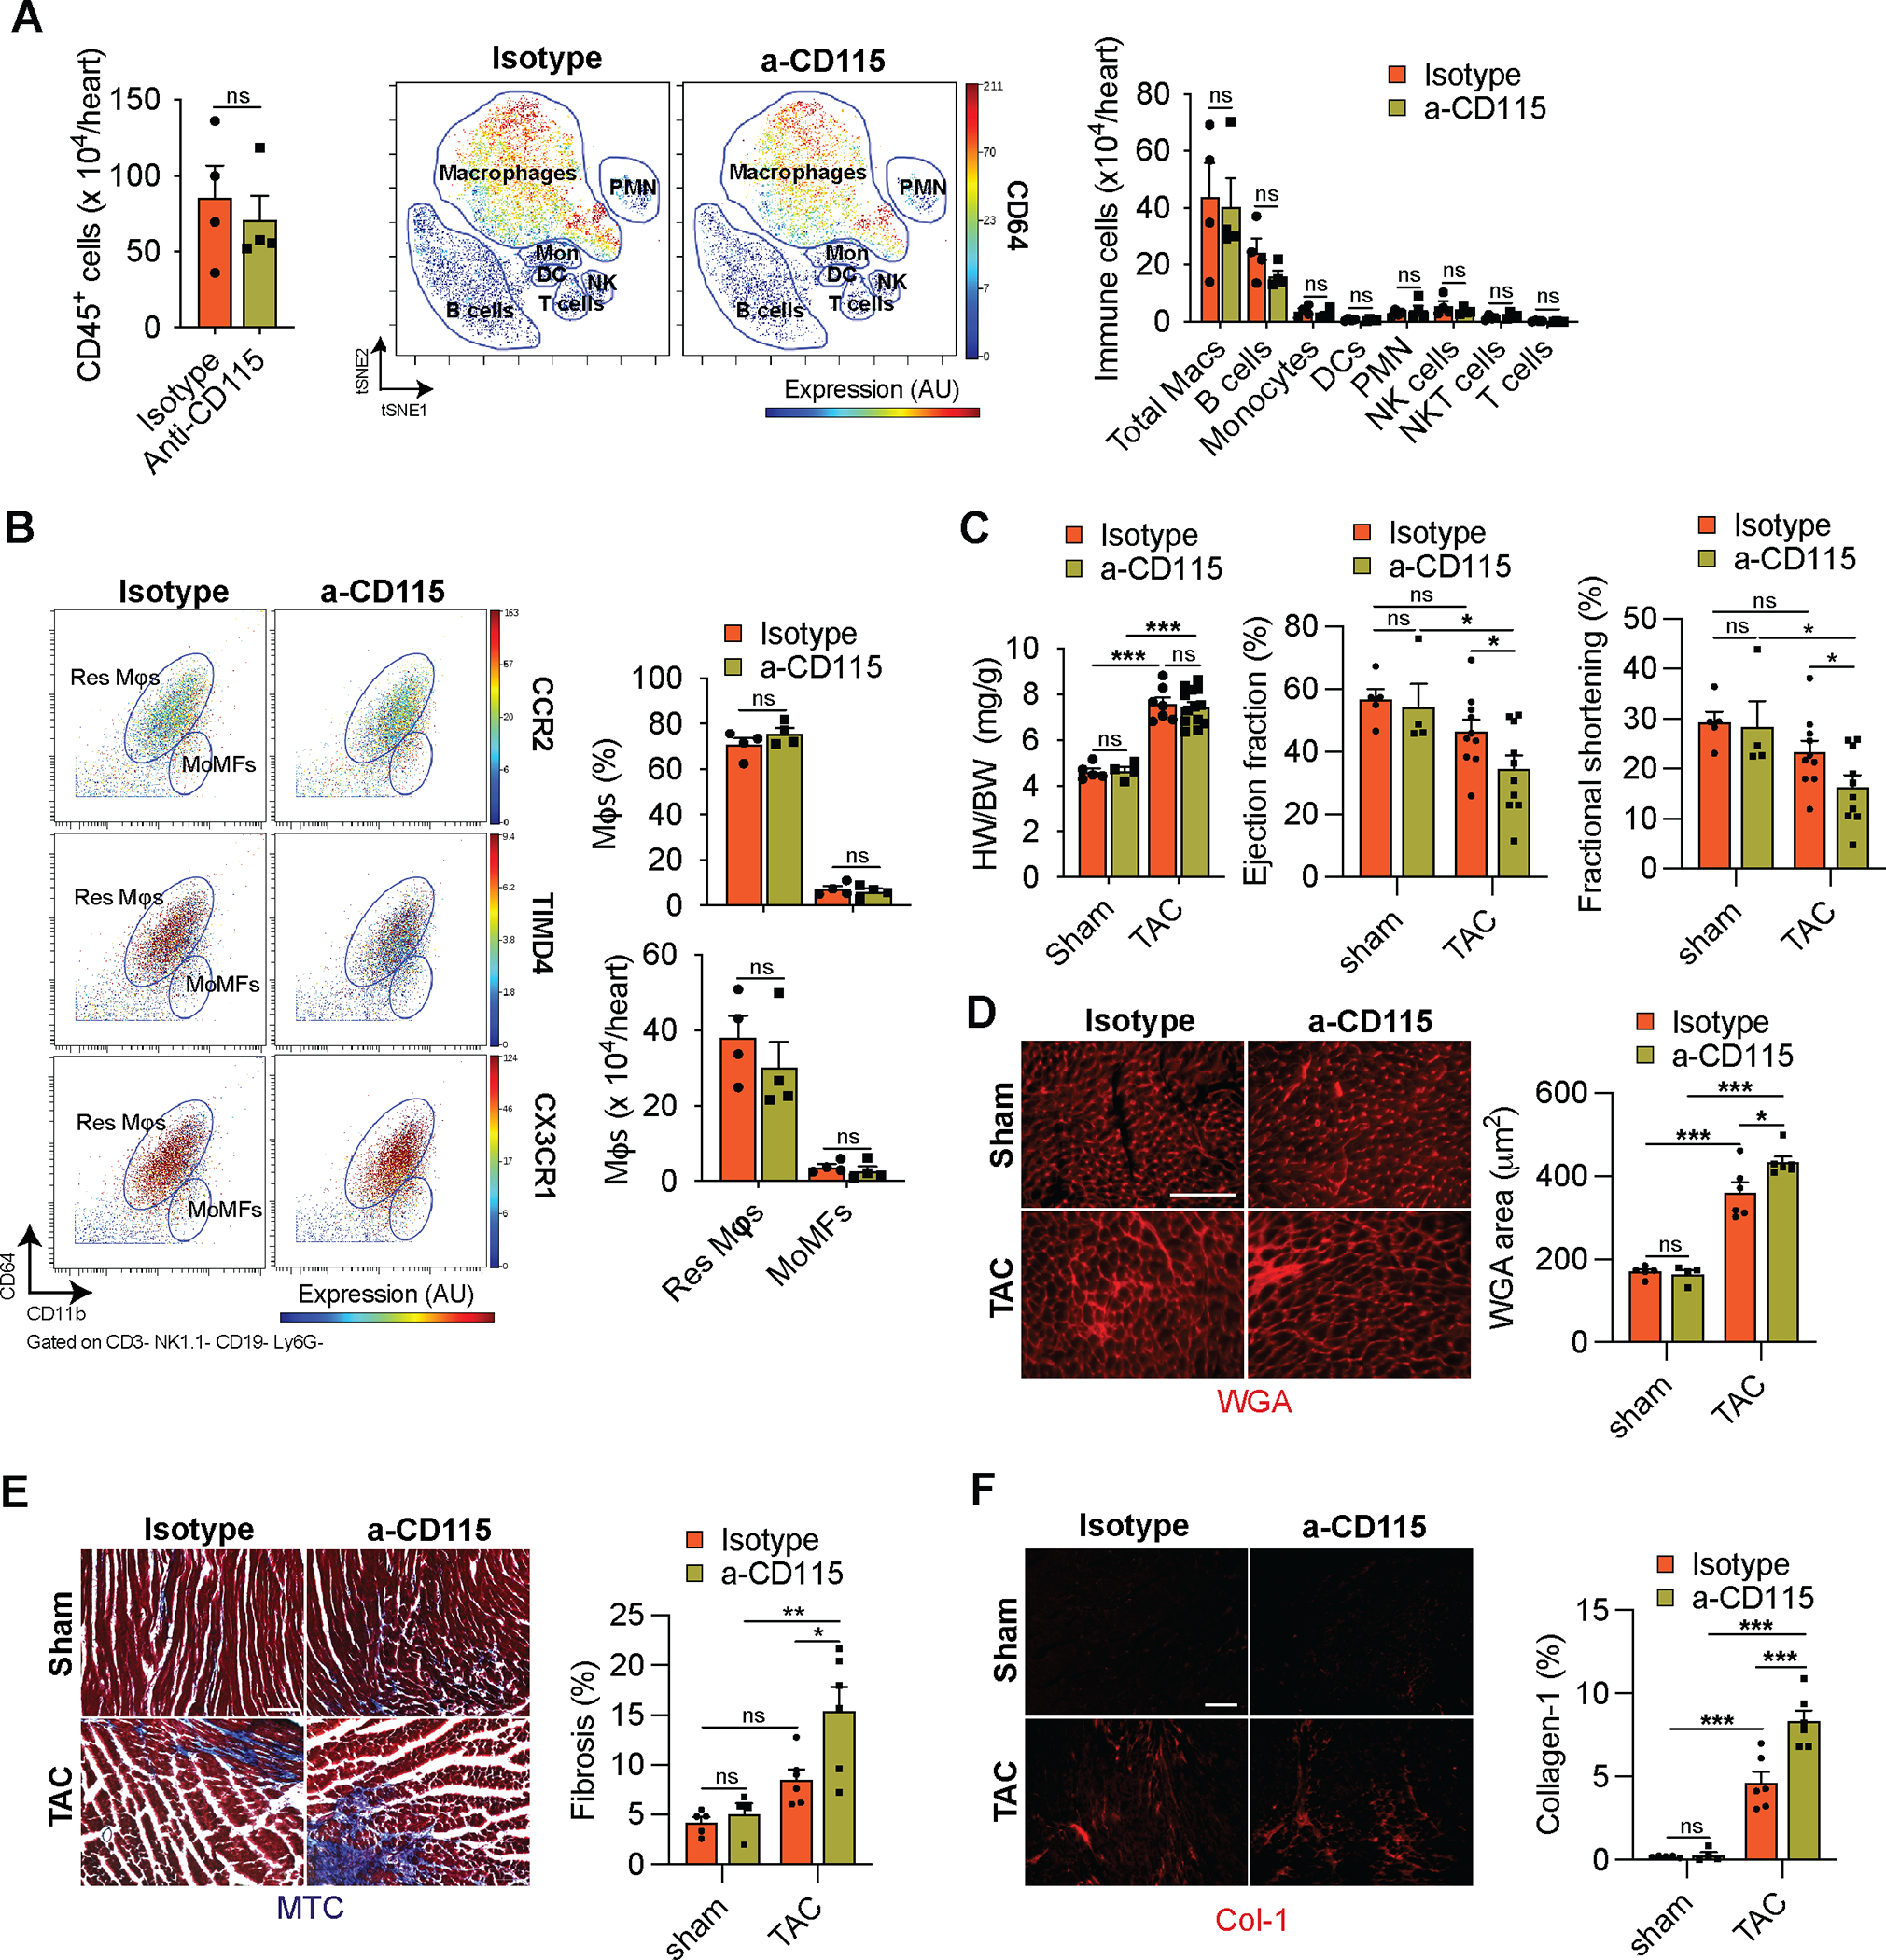
Figure 8. Depletion of cardiac macrophages leads to decreased cardiac function.

A. CyTOF-based quantification of cardiac immune cells (left), viSNE plot showing the abundance of different immune cells and colored expression of CD64 in arbitrary units (AU, middle), and quantification of immune cell abundance (right) 6 weeks after TAC surgery in isotype or α-CD115 antibody administration (n=4). Statistical significance between the isotype and α-CD115 antibody-treated groups by cell type was determined by two-tailed Mann-Whitney U tests. B. Representative CyTOF plots (left) showing Res Mφs and MoMFs gated based on CD11b and CD64. The dot color represents the level of CCR2, TIMD4, and CX3CR1 expression. Quantification (right) of Res Mφs and MoMFs 6 weeks after TAC in mice which received isotype or α-CD115 antibody administration (n=4). Statistical significance between the isotype and α-CD115 antibody-treated groups was determined by two-tailed Mann-Whitney U tests. C. Cardiac hypertrophy (left, heart weight (HW) to body weight (BW) ratio), ejection fraction (middle), and fractional shortening (right) in sham and TAC mice after isotype or α-CD115 antibody administration (n=5, 4, 6, 6). Statistical significance was evaluated by a two-way ANOVA. All pairwise comparisons were made. Tukey’s tests were used to correct for multiple comparisons. D. Representative images (left) and area quantification (right) of Wheat Germ Agglutinin-stained sections from isotype or α-CD115 antibody administered mice 6 weeks after sham and TAC (n=5, 4, 6, 6). Statistical significance was evaluated by a two-way ANOVA. All pairwise comparisons were made. Tukey’s tests were used to correct for multiple comparisons. E. Representative images (left) and quantification (right) of Masson’s Trichrome-stained sections from isotype or α-CD115 antibody administered mice 6 weeks after sham and TAC (n=5, 4, 6, 6). Statistical significance was evaluated by a two-way ANOVA. All pairwise comparisons were made. Tukey’s tests were used to correct for multiple comparisons. F. Representative images (left) and quantification (right) of collagen-1-stained sections from isotype or α-CD115 antibody administered mice 6 weeks after sham and TAC (n=5, 4, 6, 6). Statistical significance was evaluated by a two-way ANOVA. All pairwise comparisons were made. Tukey’s tests were used to correct for multiple comparisons. Statistical significance is summarized as *(p<0.05), **(p<0.01), and ***(p<0.001). Scale bar=100μm
