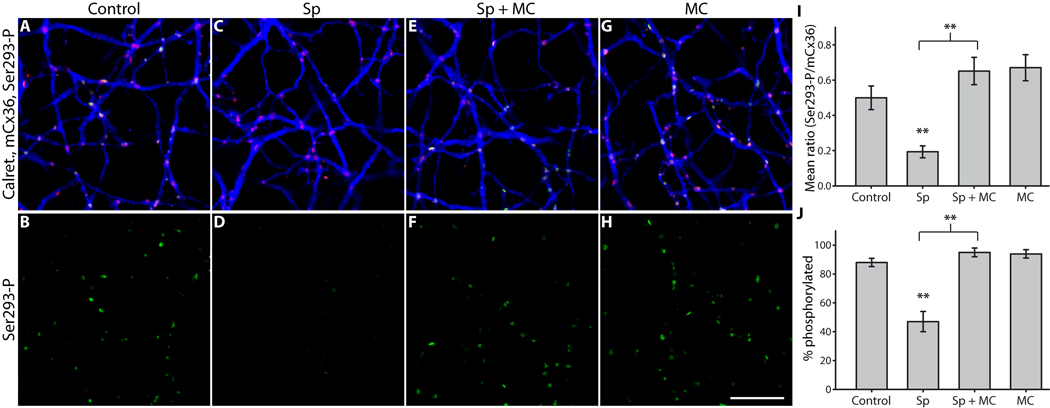
Figure 6. PP2A is required for PKA-dependent dephosphorylation of Cx36 at Ser293 in AII amacrine cells.
A & B, Control; color scheme and antibodies are the same as Figure 2. C & D, PKA activation (Sp-8-CPT-cAMPS, 20 µM) greatly diminished Ser293-P labeling, just as D1R activation did. E & F, Inhibition of PP2A (microcystin-LR, 0.5 nM) completely blocked the reduction in Ser293 phosphorylation caused by PKA activation. G & H, Inhibition of PP2A alone slightly increased Ser293 phosphorylation relative to control. I, Summary of data shows that inhibition of PP2A significantly blocked the reduction in Ser293 phosphorylation caused by PKA activation. We observed a trend towards increased Ser293 phosphorylation when PP2A alone was inhibited, similar to the significant increase we observed previously with the same treatment (Fig. 4). J, Summary of data shows that changes in the percentage of Cx36 plaques that show detectable Ser293-P labeling follows the same pattern established for relative Ser293-P measurements in I. Error bars are s.e.m, n = 5. Two asterisks denote P < 0.01. Images are 1 µm-deep stacks. Scale bar in H is 10 µm.

