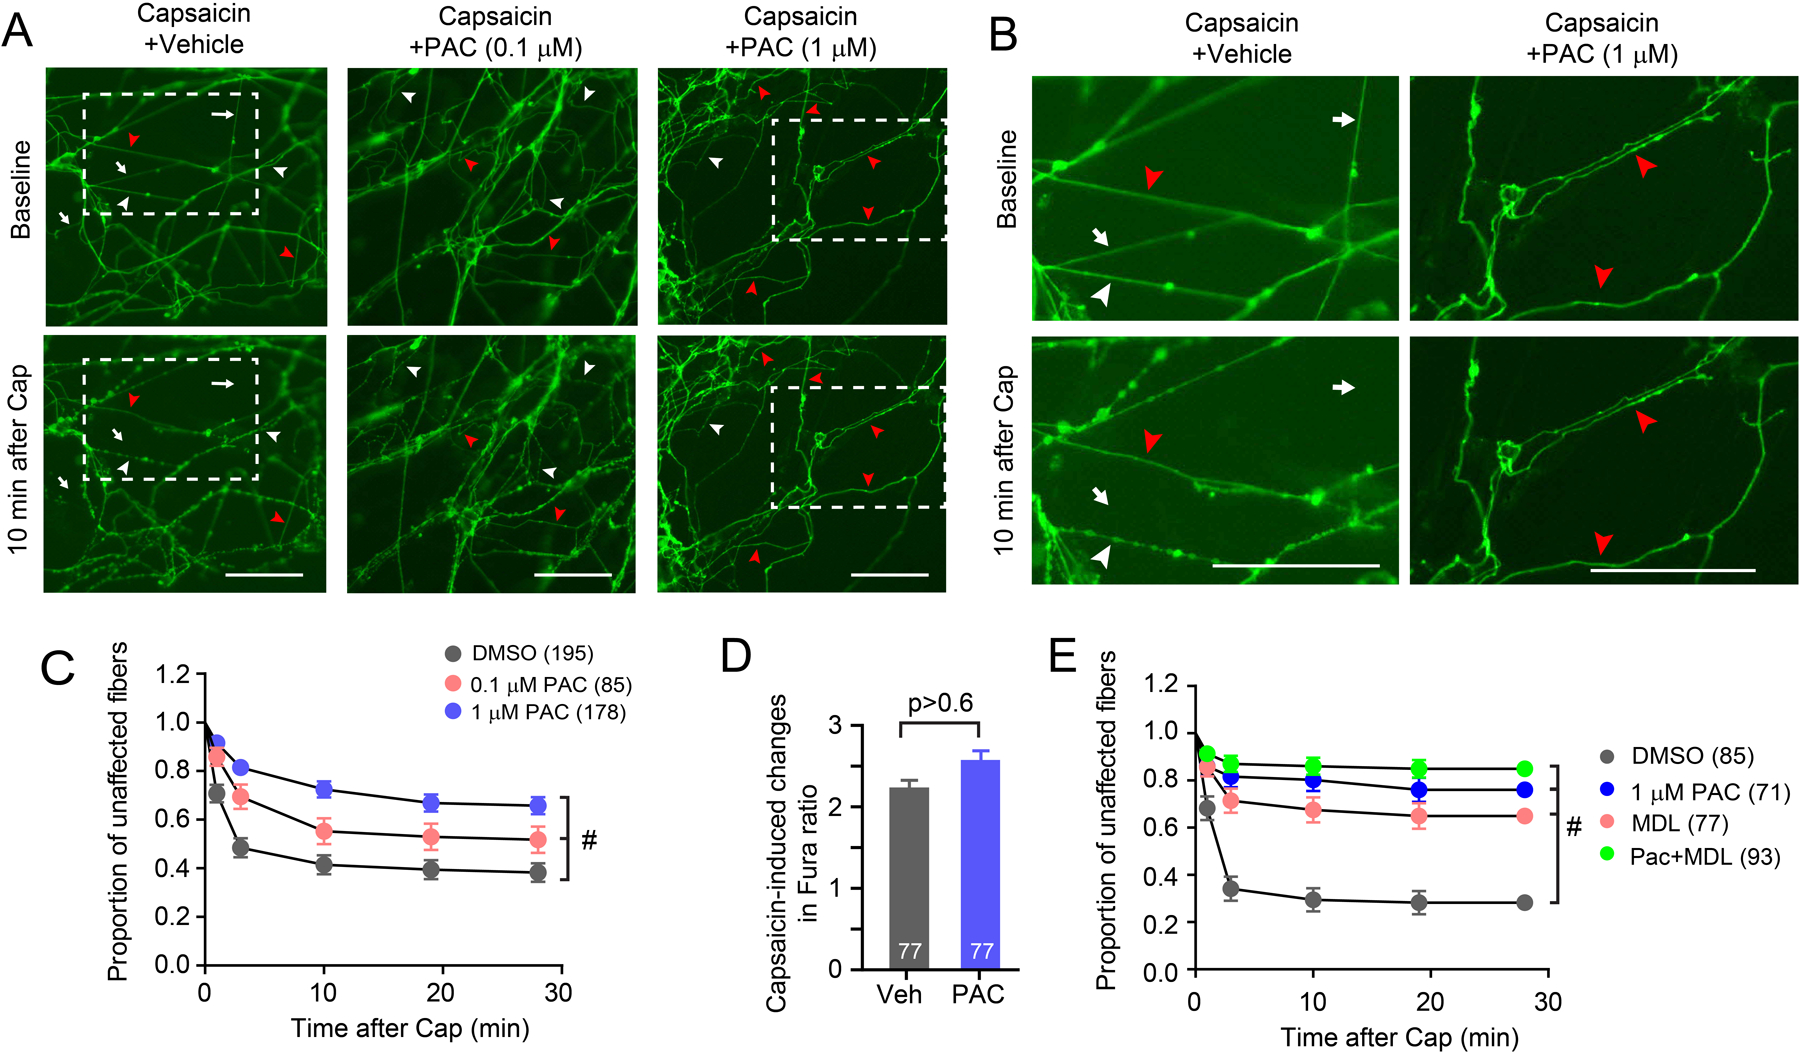
Fig. 1.

Paclitaxel inhibits capsaicin-induced axonal ablation. (A) Representative time-lapsed imaging of axonal terminals from microfluidic chambers (MFCs). Fluorescence signals from GFP were monitored before and 10 minutes after the axonal compartment was exposed to capsaicin (100 μM) plus vehicle, paclitaxel (PAC), 0.1 μM or 1 μM as indicated. Scale bar, 50 μm; arrows, examples of ablated fibers; white arrow heads, beaded fibers; red arrow heads, fibers not affected. Dotted boxes, the areas shown in panel B. (B) Enlarged images of the areas are indicated in panel A. Scale bar, 50 μm. (C) Proportion of unaffected fibers after the application of 100 μM capsaicin (Cap) and paclitaxel. The survival proportion is plotted as mean±SEM. Numbers in parentheses represent the numbers of individual GFP-expressing fibers examined in each group. Results based on the Log-rank test, #p<0.0001. (D) Capsaicin-induced change of the Fura ratio in the soma of dissociated sensory neurons under the indicated conditions. Numbers within bars represent the numbers of neurons quantified in each group. Results base on the Student’s t-test. (E) Proportion of unaffected fibers after the application of 100 μM capsaicin with DMSO, 1 μM paclitaxel, 10 μM MDL28170, and paclitaxel plus MDL28170. The survival proportion is plotted as mean±SEM. Numbers in parentheses represent the numbers of individual GFP-expressing fibers examined in each group. Results are based on the Log-rank test, #p<0.0001.
