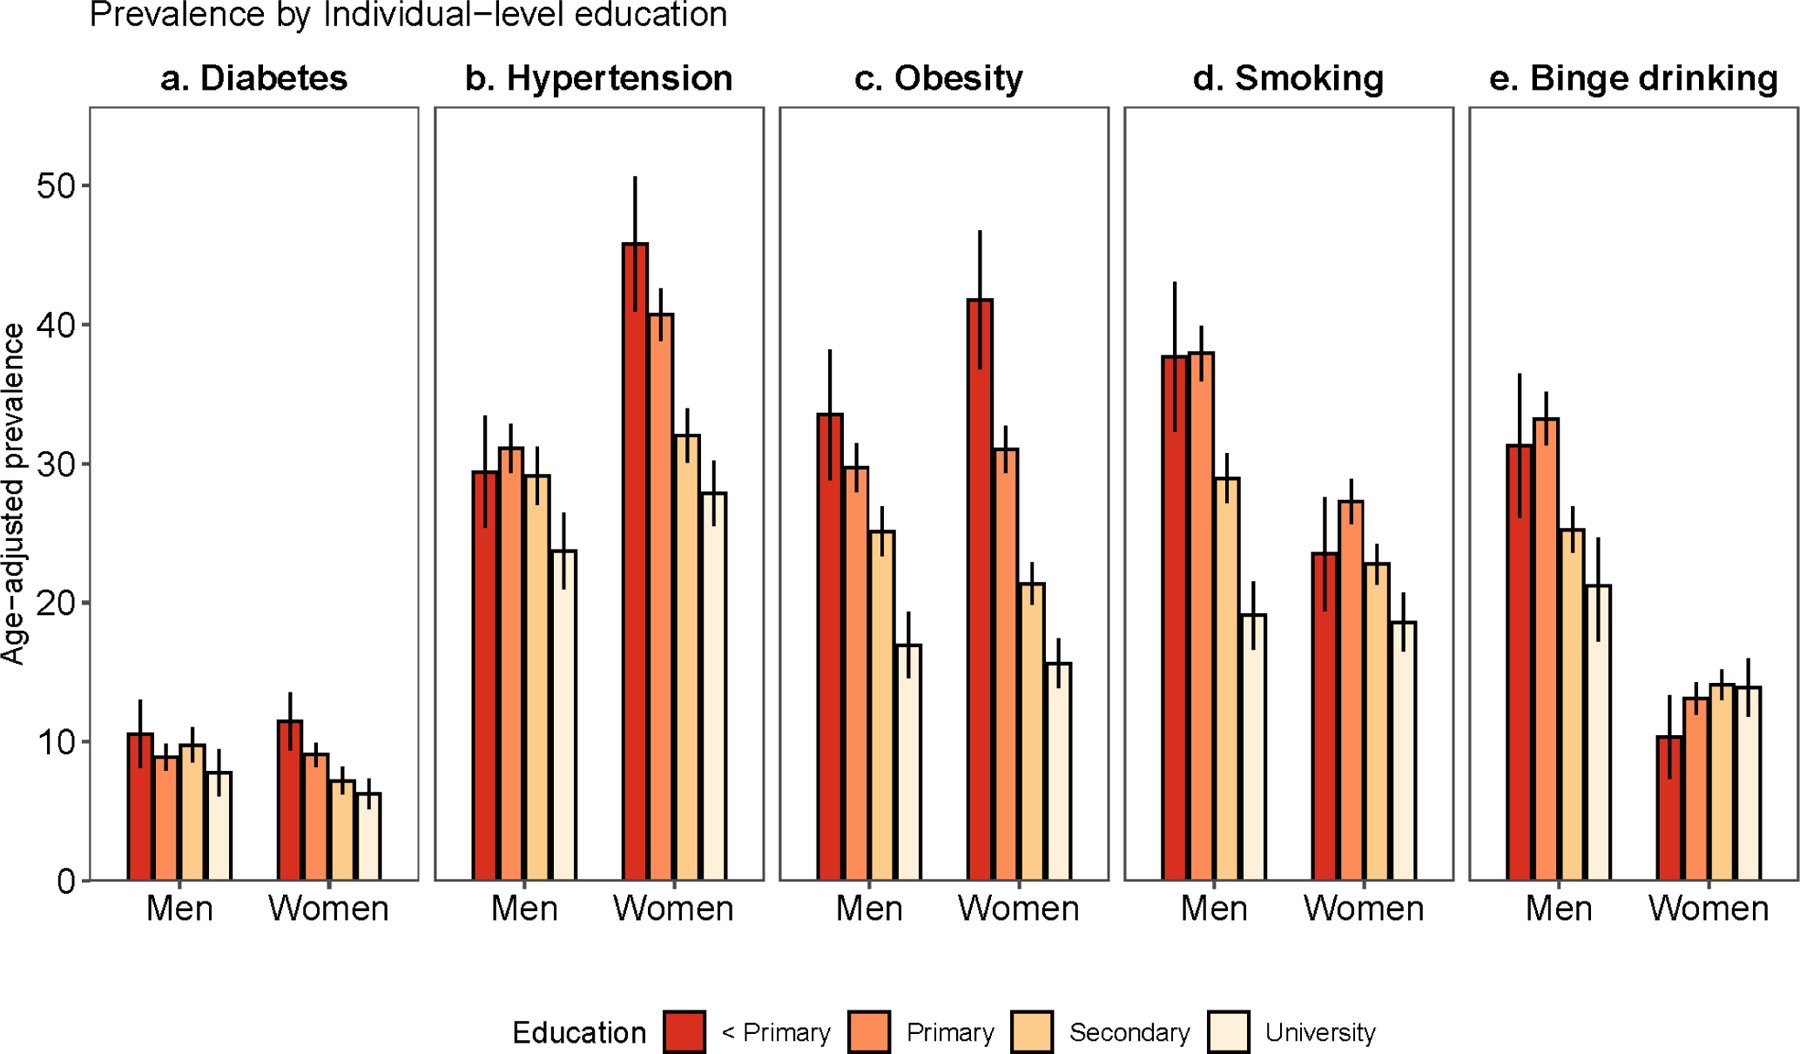
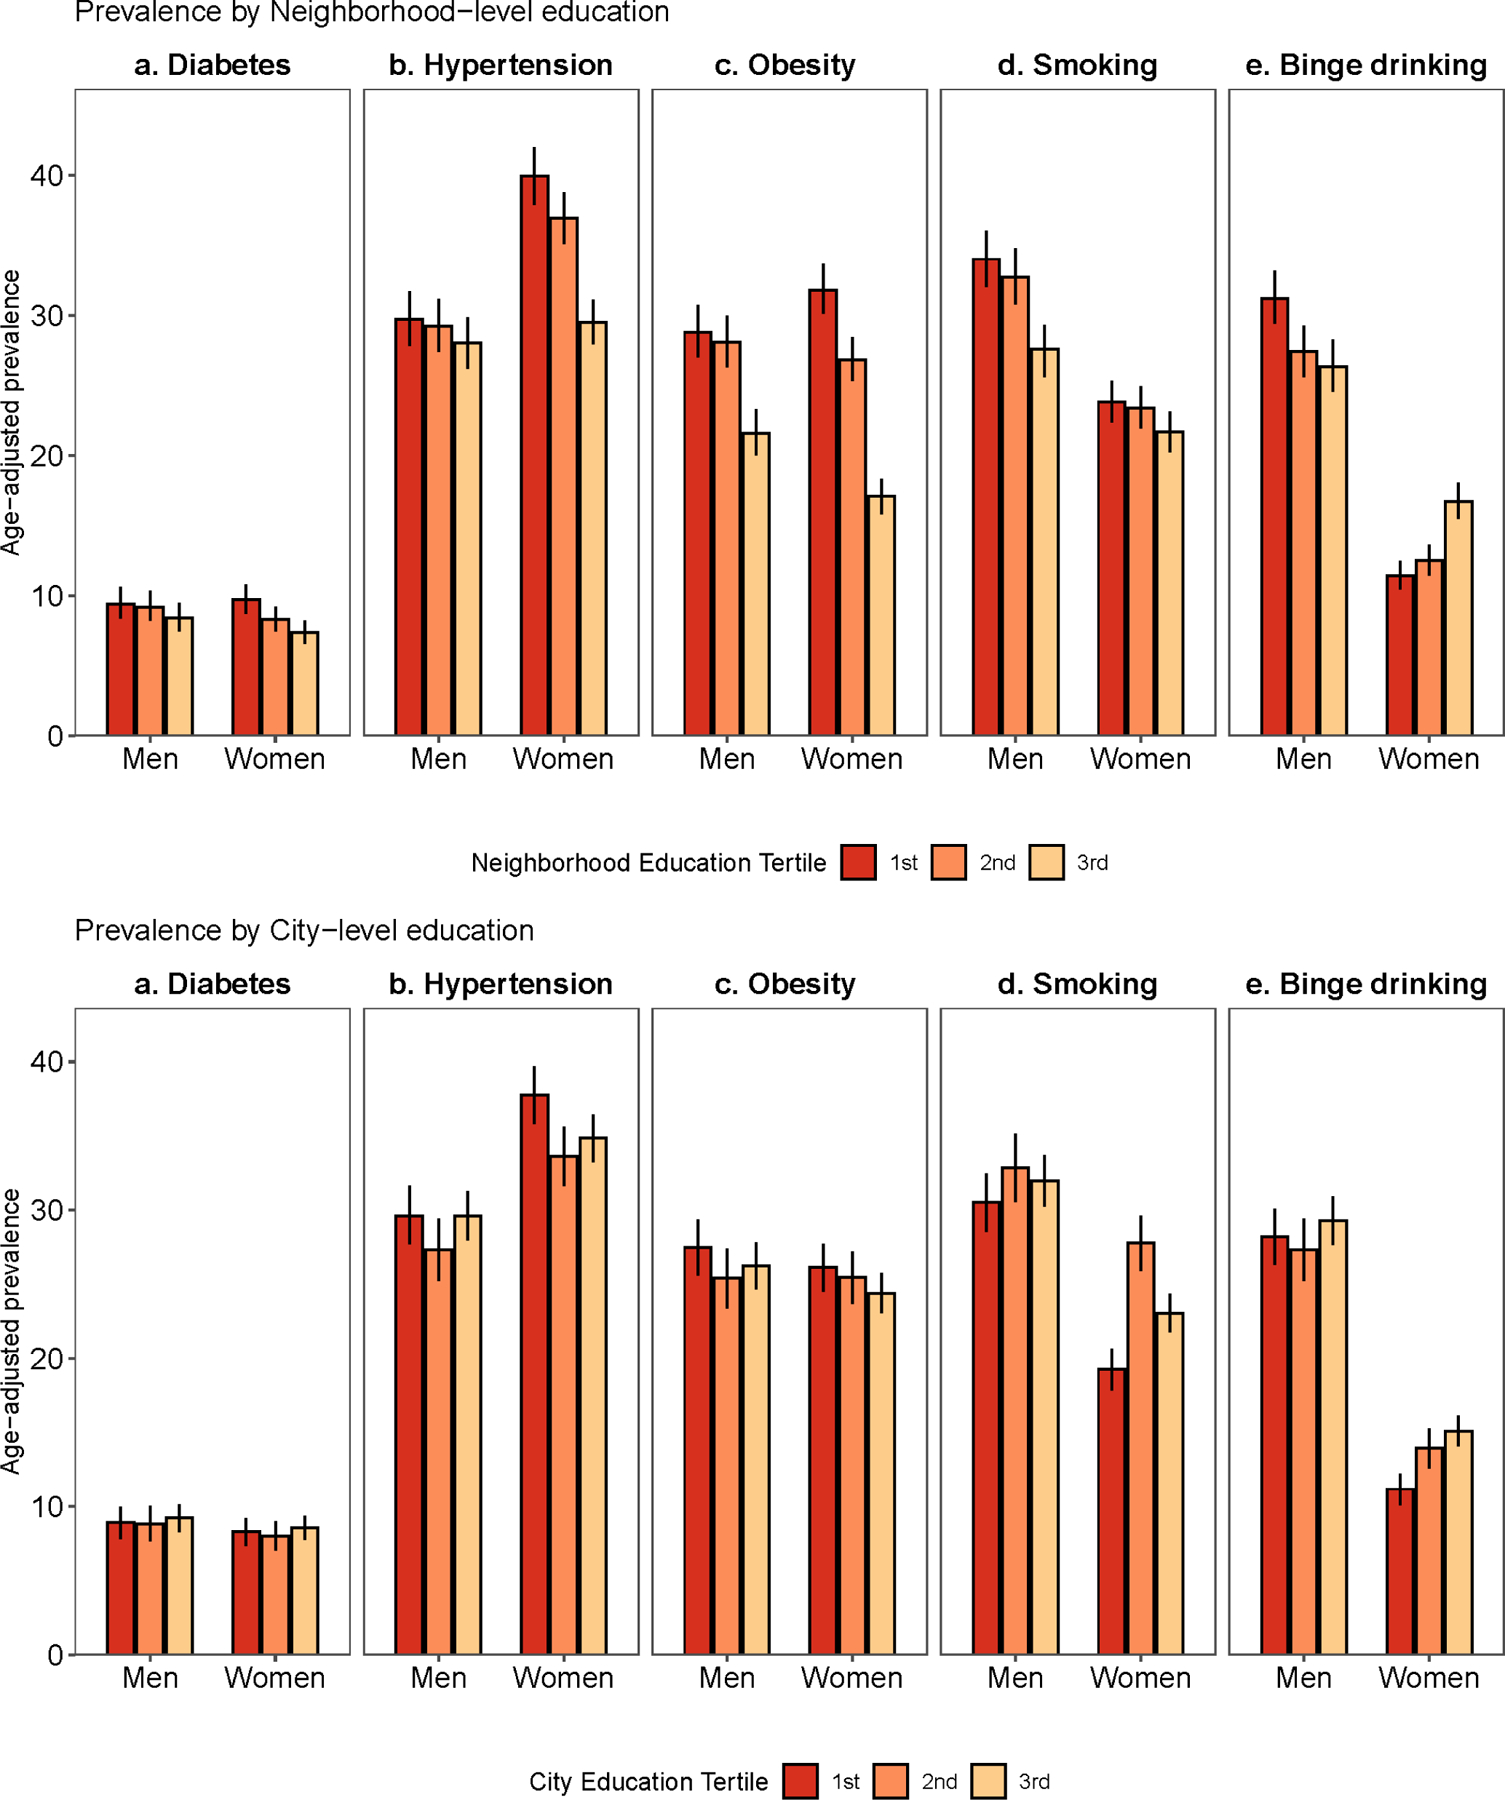
Figure 1.


Age-adjusted prevalence (95% confidence intervals) of non-communicable disease risk factors by a) individual-, b) neighborhood- and c) city-level education. Argentina, National Survey of Risk Factors, 2013.
Age-adjusted using the age distribution of the sample. 95% confidence intervals are shown in vertical lines.
