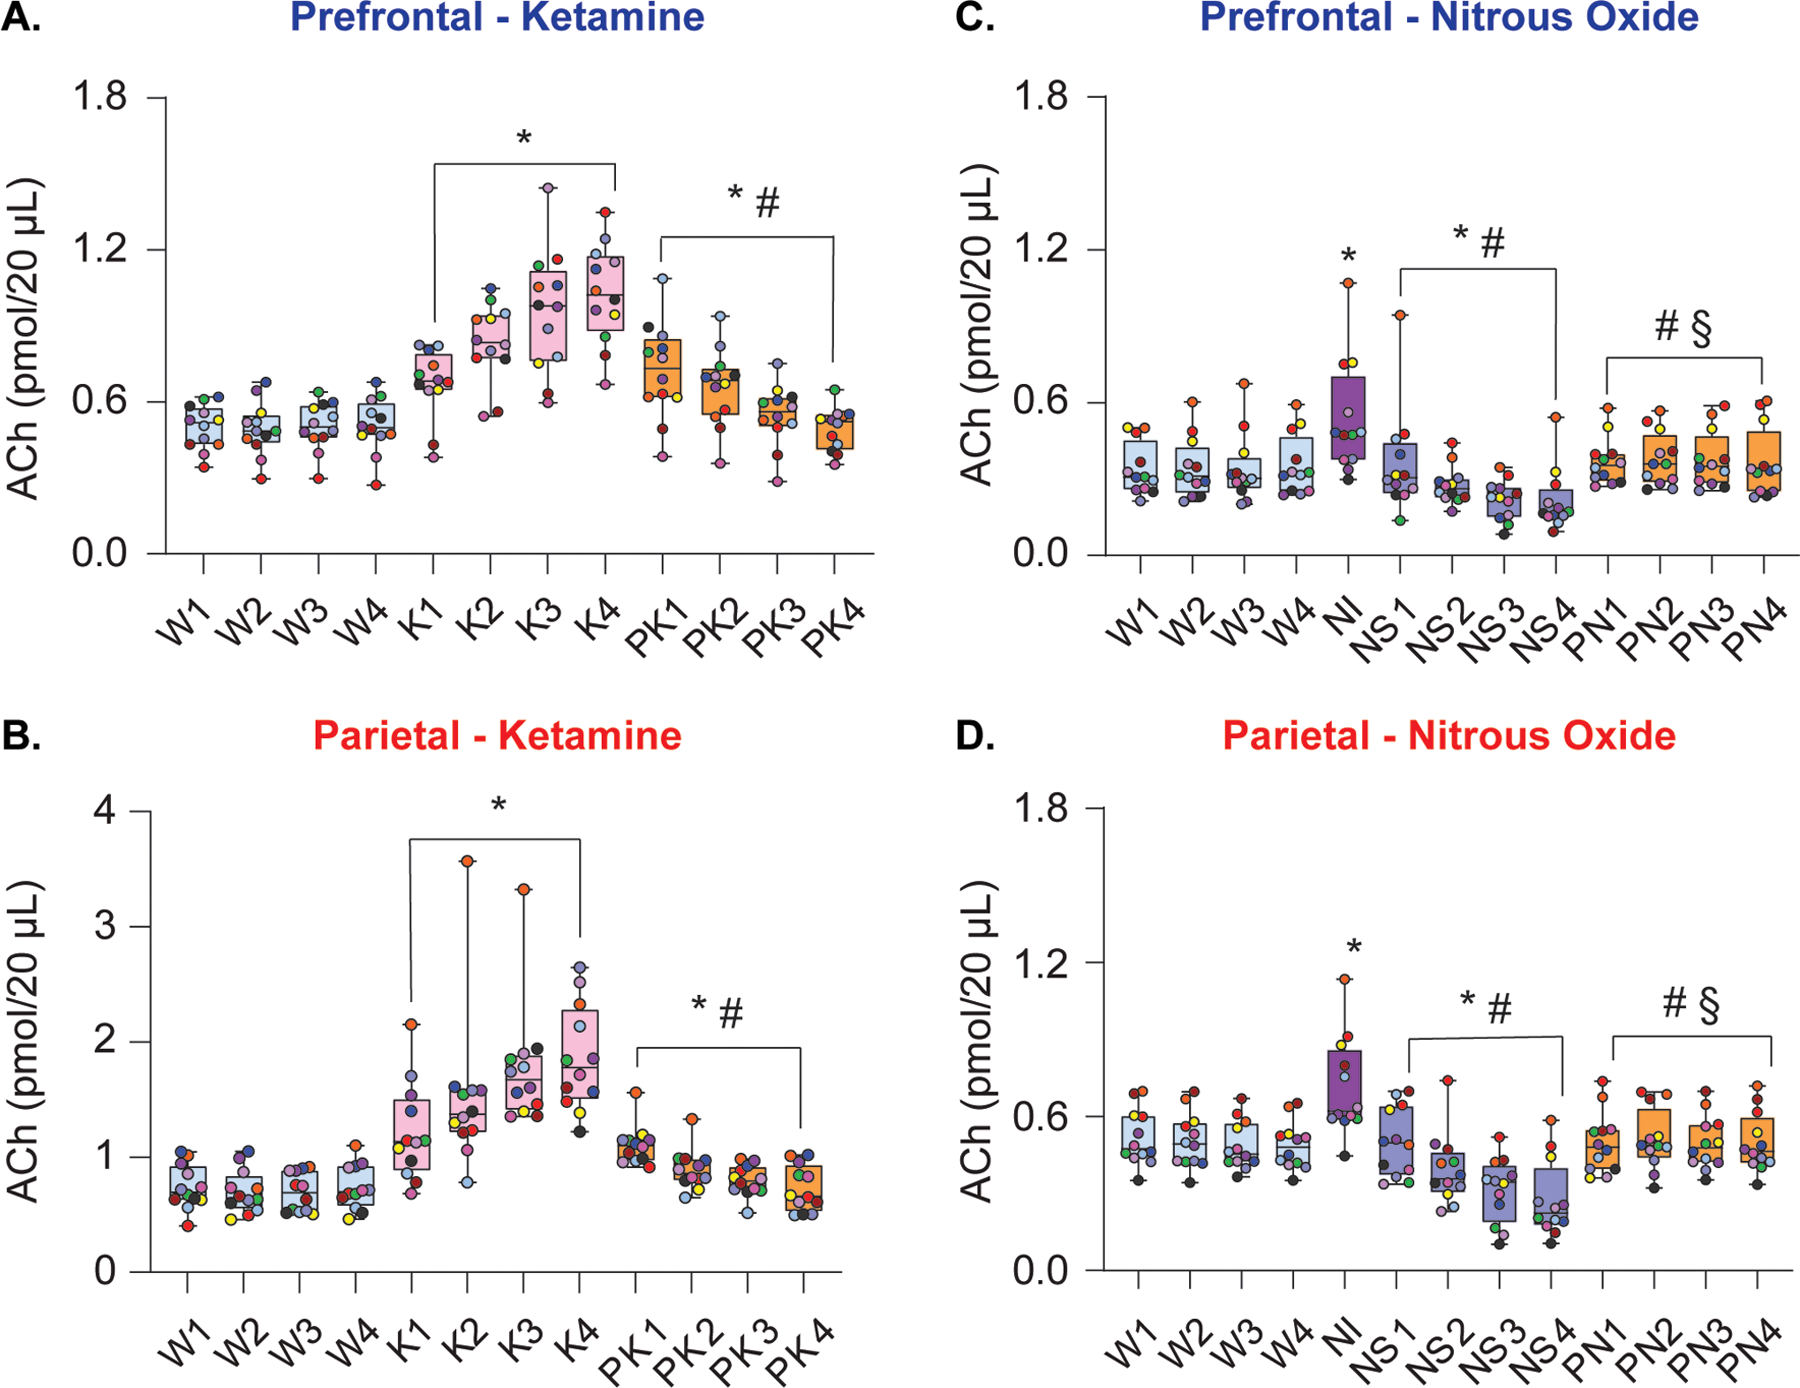
Figure 2.

Subanesthetic ketamine and nitrous oxide administration produced differential effects on cortical acetylcholine levels. Subanesthetic ketamine infusion produced sustained increase in prefrontal (A) and parietal (B) acetylcholine levels. During post-ketamine recovery, cortical acetylcholine levels remained elevated compared to wakefulness, though this effect was largely driven by the first 2 post-ketamine epochs (A, B). In contrast, 50% nitrous oxide treatment transiently increased prefrontal and parietal acetylcholine levels during the first 12.5 min of exposure (nitrous induction), followed by a progressive decline in acetylcholine during nitrous oxide sedation phase (C, D). Cortical acetylcholine levels during post-nitrous oxide recovery did not significantly differ from those observed during baseline wake state (C, D). A linear mixed model with a random intercept for each rat was used for statistical comparisons. Post hoc pairwise tests between states were performed with single-step correction for multiple comparisons via Tukey’s Test. The box plots show the median (horizontal bar) and interquartile range for averaged data over all 12 subjects at each epoch. The whiskers represent the minimum and maximum values within each epoch. The data for each subject are displayed by colored dots, with each color corresponding to a single subject across all epochs. ACh – acetylcholine, K – subanesthetic ketamine infusion, NI – nitrous oxide induction, NS – nitrous oxide sedation, PK – post-ketamine recovery, PN – post-nitrous oxide, W – wake. *Significant compared to wake, #significant compared to subanesthetic ketamine infusion or nitrous oxide induction, §significant compared to nitrous oxide sedation. The statistical comparisons are shown at P < .05. The exact P values are provided in the text in the results section. The mean, SD, and F-statistics for statistical comparisons are provided in Supplemental Digital Content, Tables 1–2.
