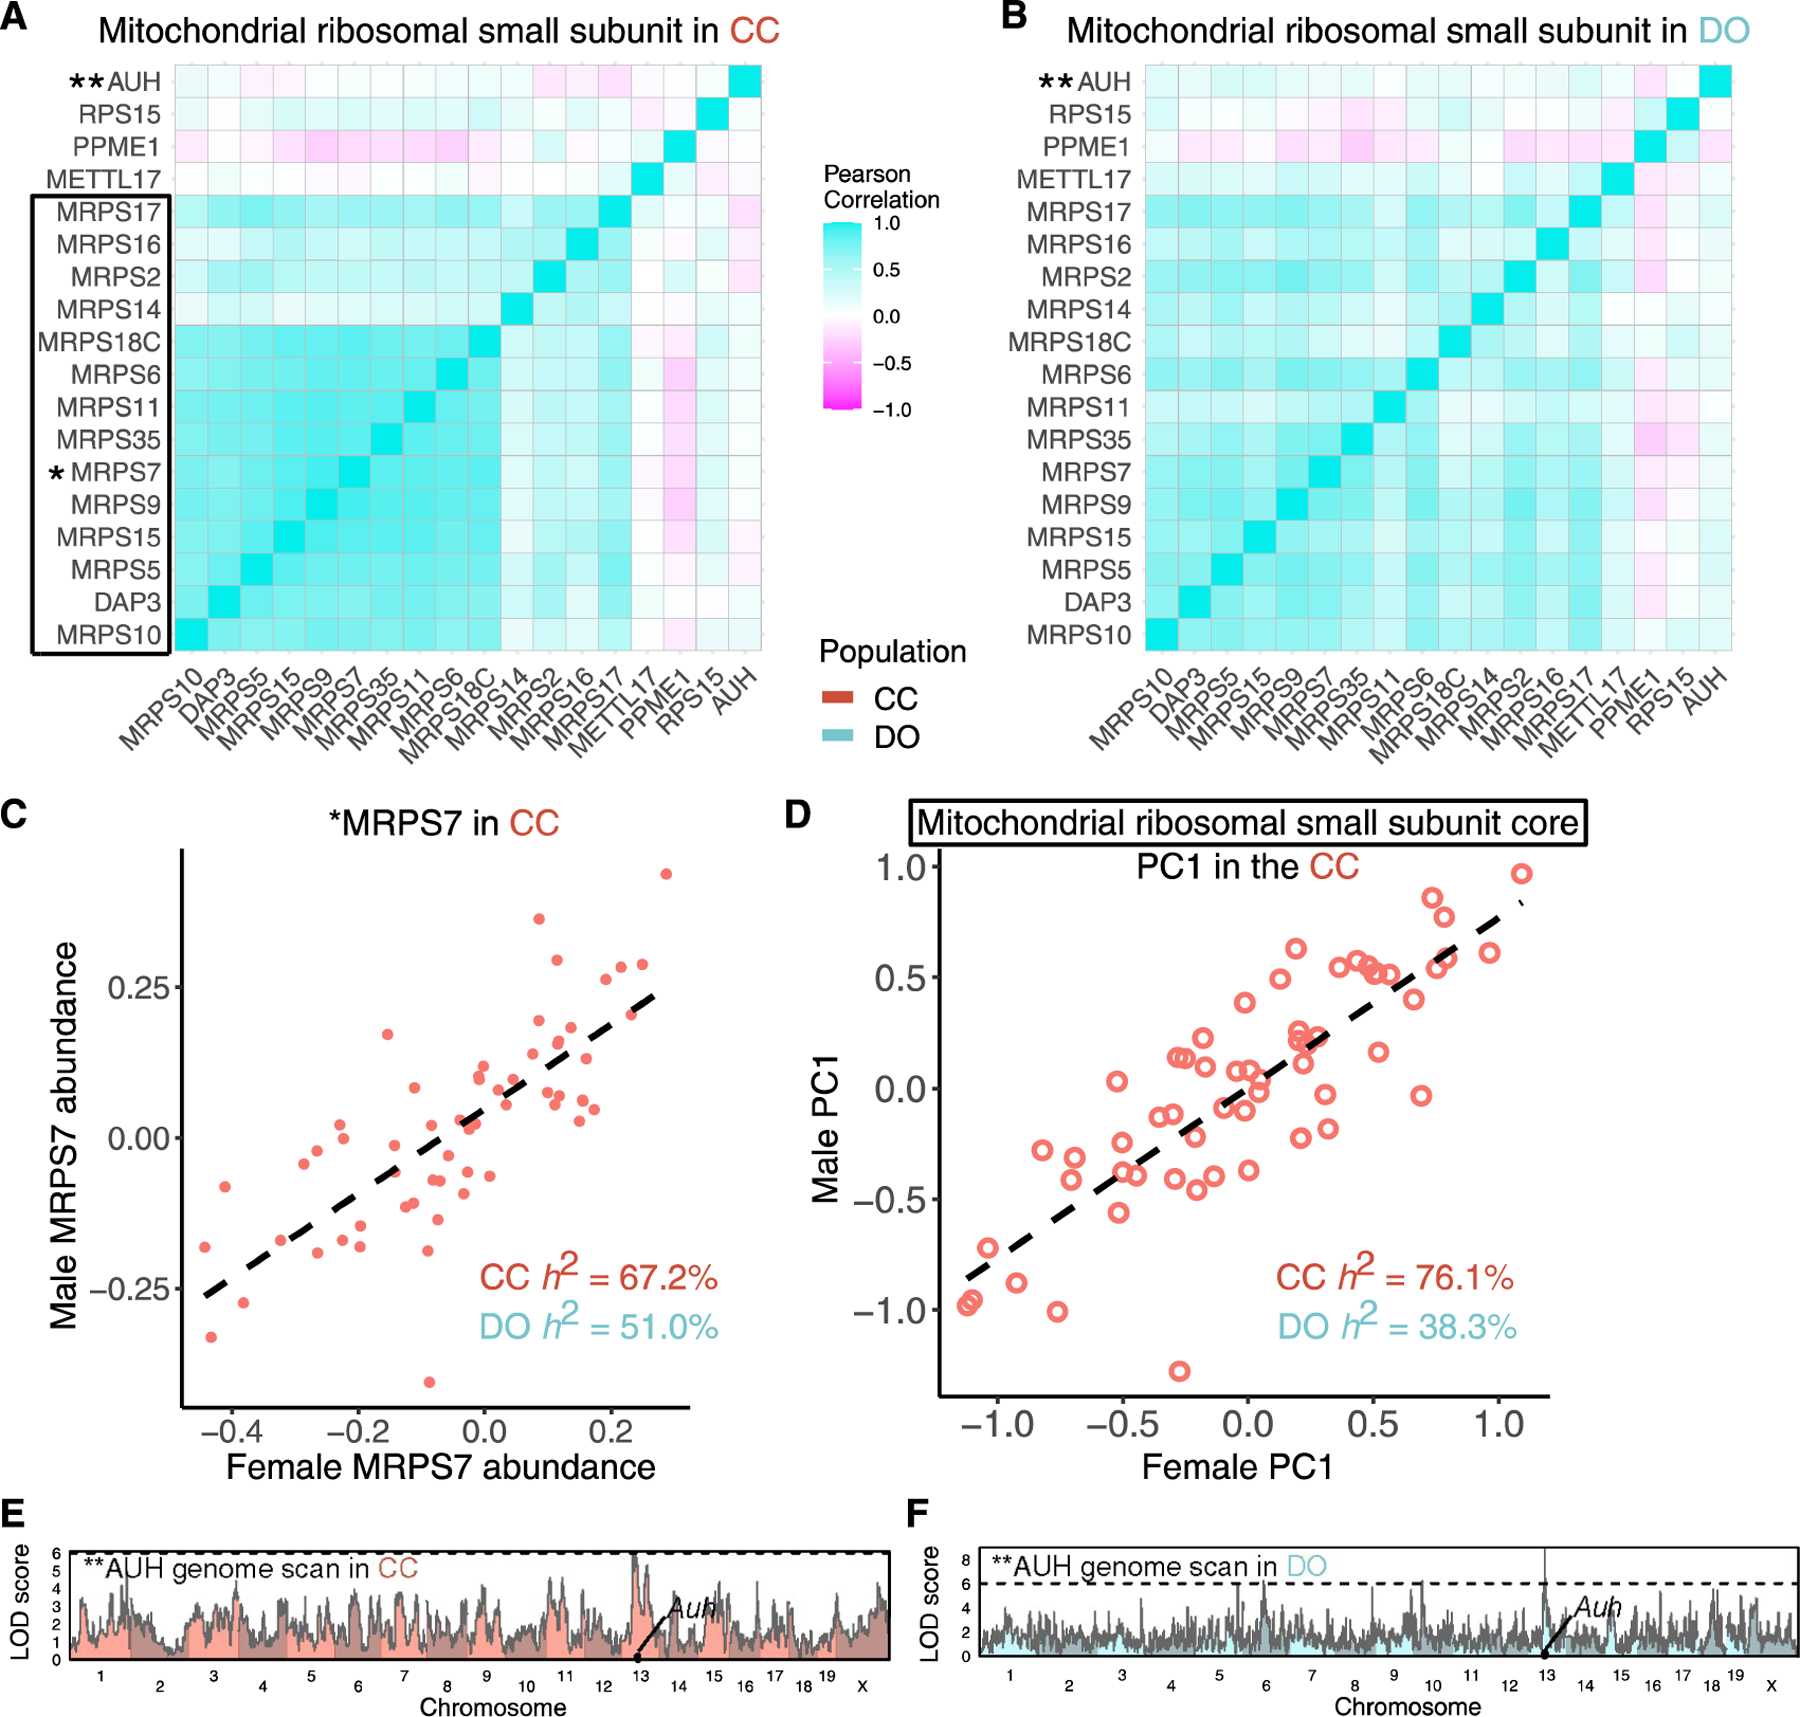
Figure 6. Polygenic regulation of the mitochondrial ribosomal small subunit (MRSS).

(A and B) The Pearson correlations of the MRSS in (A) CC and (B) DO mice.
(C and D) MRPS7 (*) abundance (C) and PC1 of protein abundances from the MRSS core (black box) (D) plotted as males versus females for the CC strains. The dashed lines represent the best fit lines between males and females for MRPS7 and complex PC1.
(E and F) Genome scans for AUH (**), a protein affiliated with the mitochondrial ribosome that is largely uncorrelated with core members of the complex, reveal a local pQTL detected in (E) CC and (F) DO mice. Horizontal lines at a LOD score of 6 are included as a reference point across genome scans.
