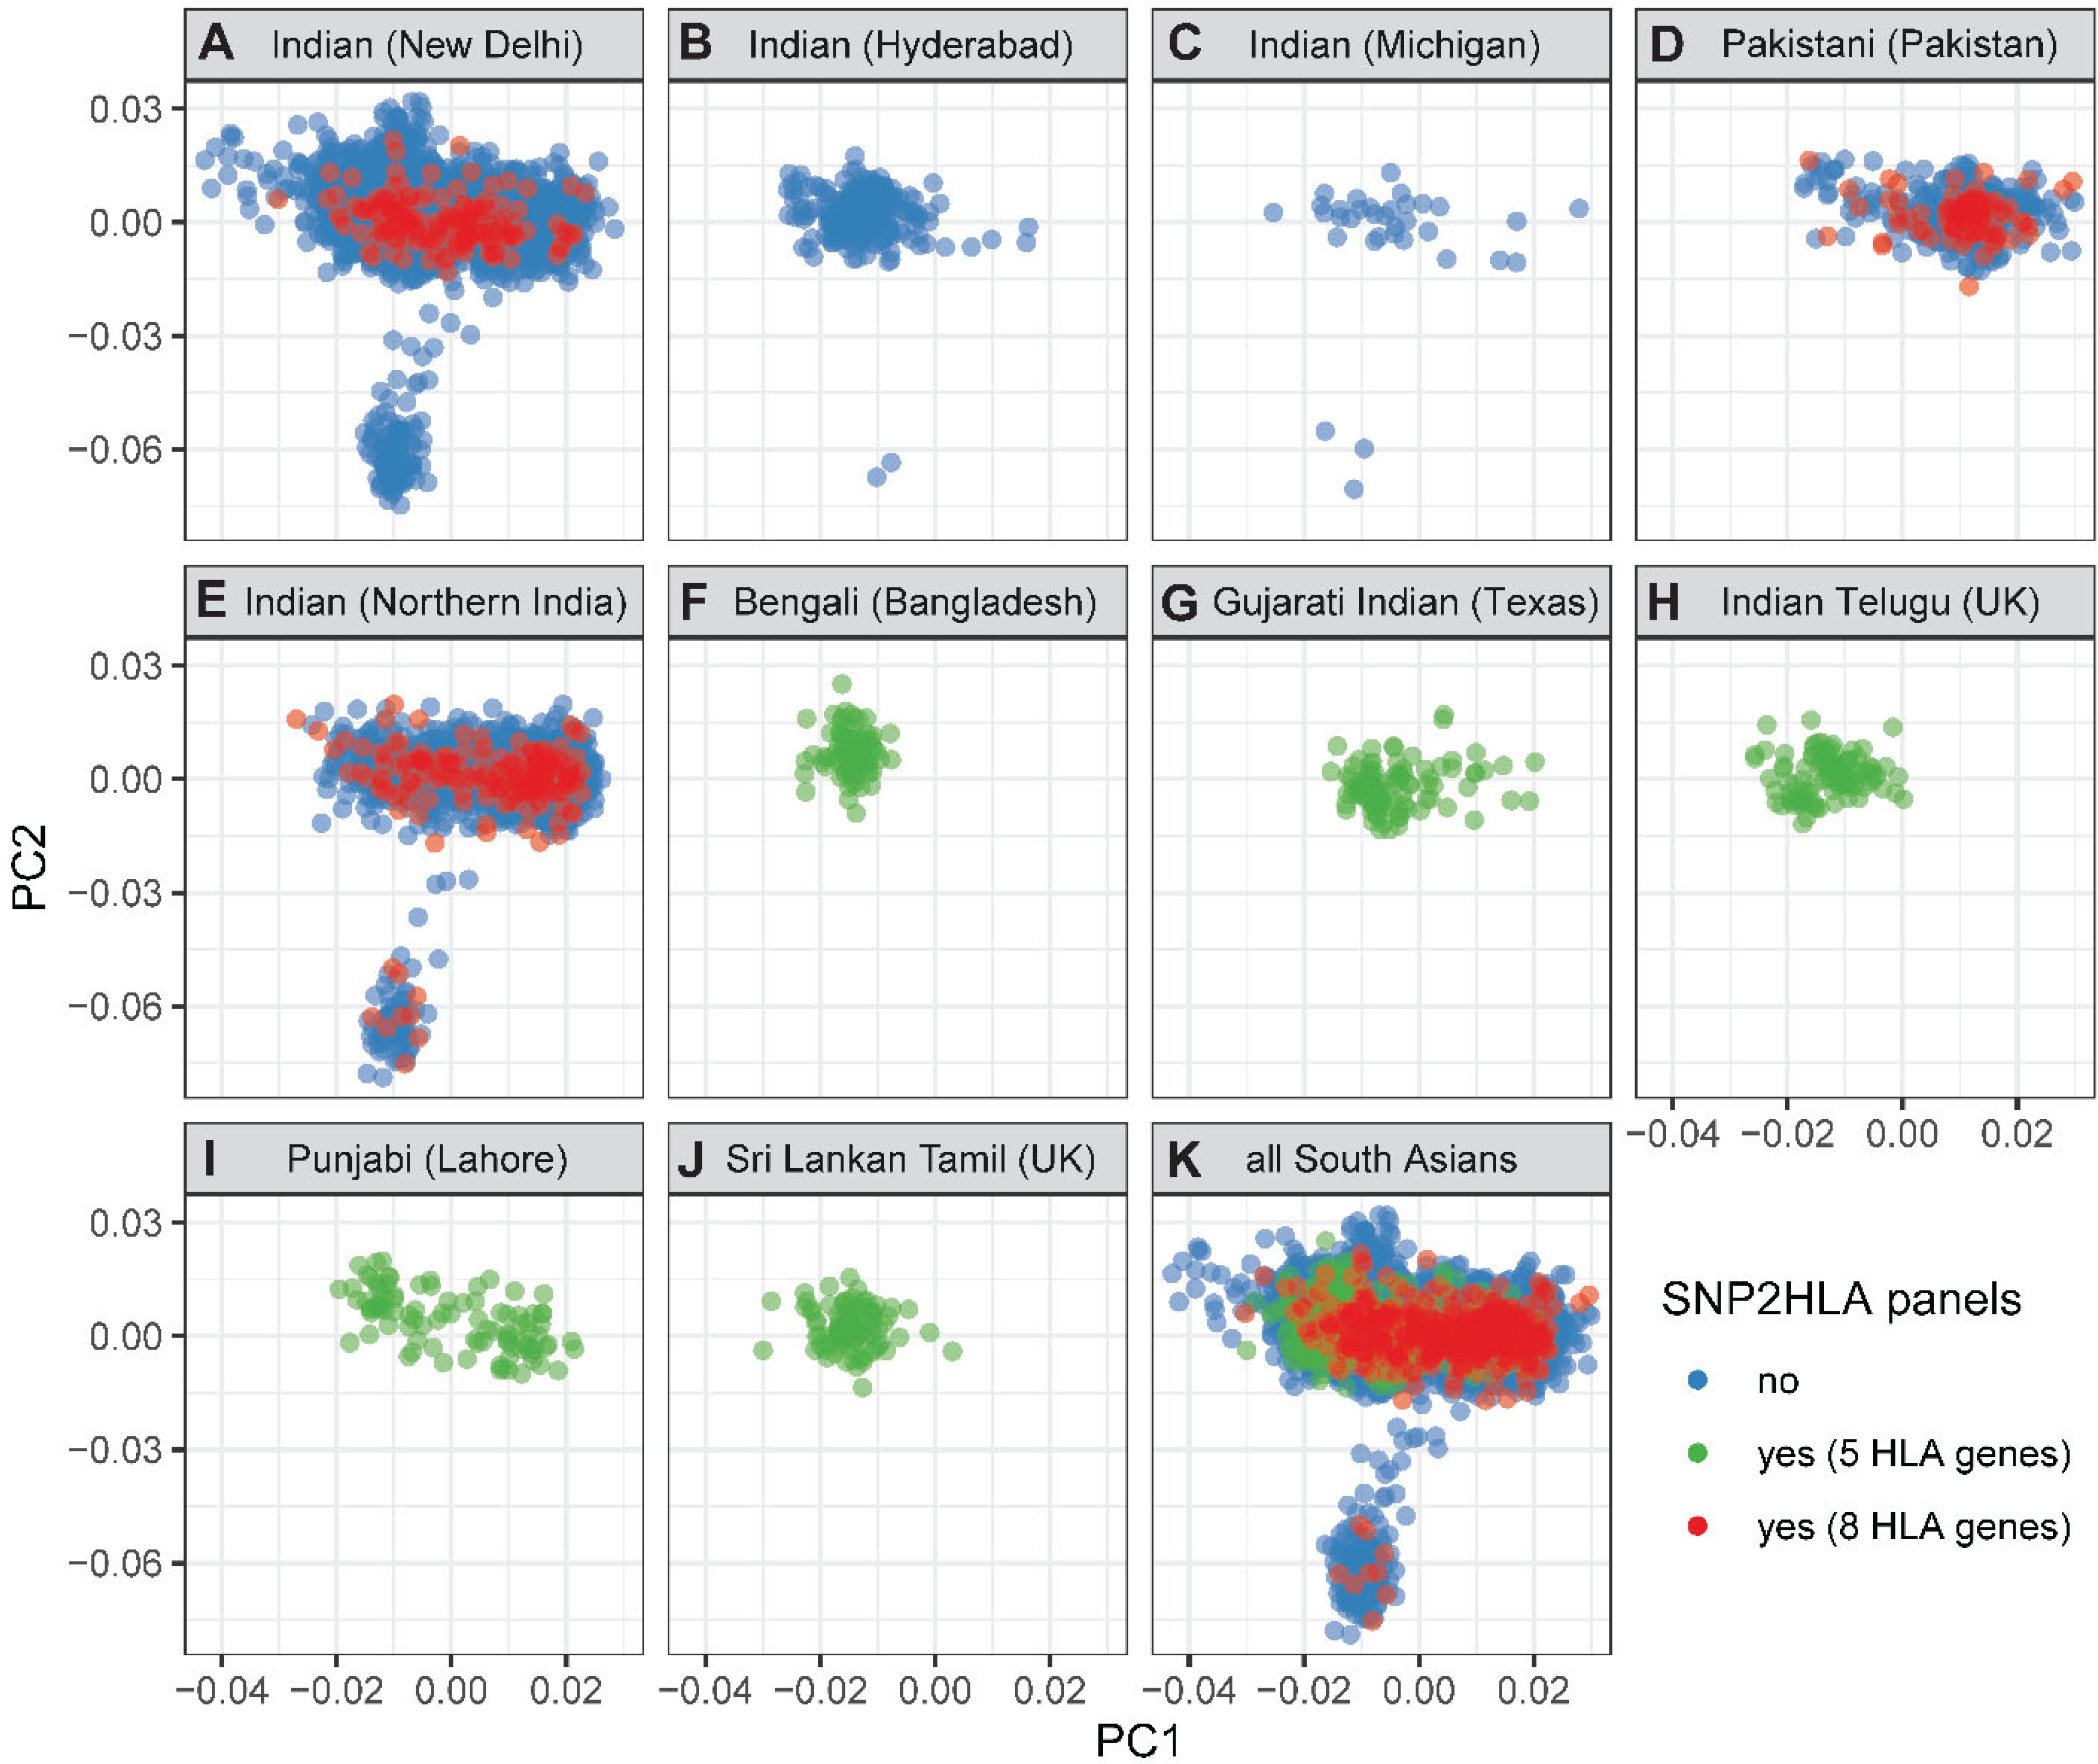
Figure 3. Population structure of South Asians in the SNP2HLA reference panels.

The first two principal components from a PCA analysis of 6,421 individuals of South Asian ancestry are shown. Panels A–J show results divided by 10 different source populations: populations in panel A–D are from the psoriasis GWAS of this study, the population in panel E is from an inflammatory bowel disease case-control cohort of B.K. Thelma, and populations in panels F–J constitute the SAS superpopulation of phase 3 of the 1000 Genomes Project. Panel K shows results for all populations combined. Points are colored by whether they are part of any of the SNP2HLA panels used for imputation of HLA variants in South Asians; blue, green and red colors indicate whether the individual was not part of any panel, was part of panels used for imputation of 5 HLA genes (A, B, C, DQB1, DRB1), or was part of panels used for imputation of 8 HLA genes (A, B, C, DPA1, DPB1, DQA1, DQB1, DRB1), respectively.
