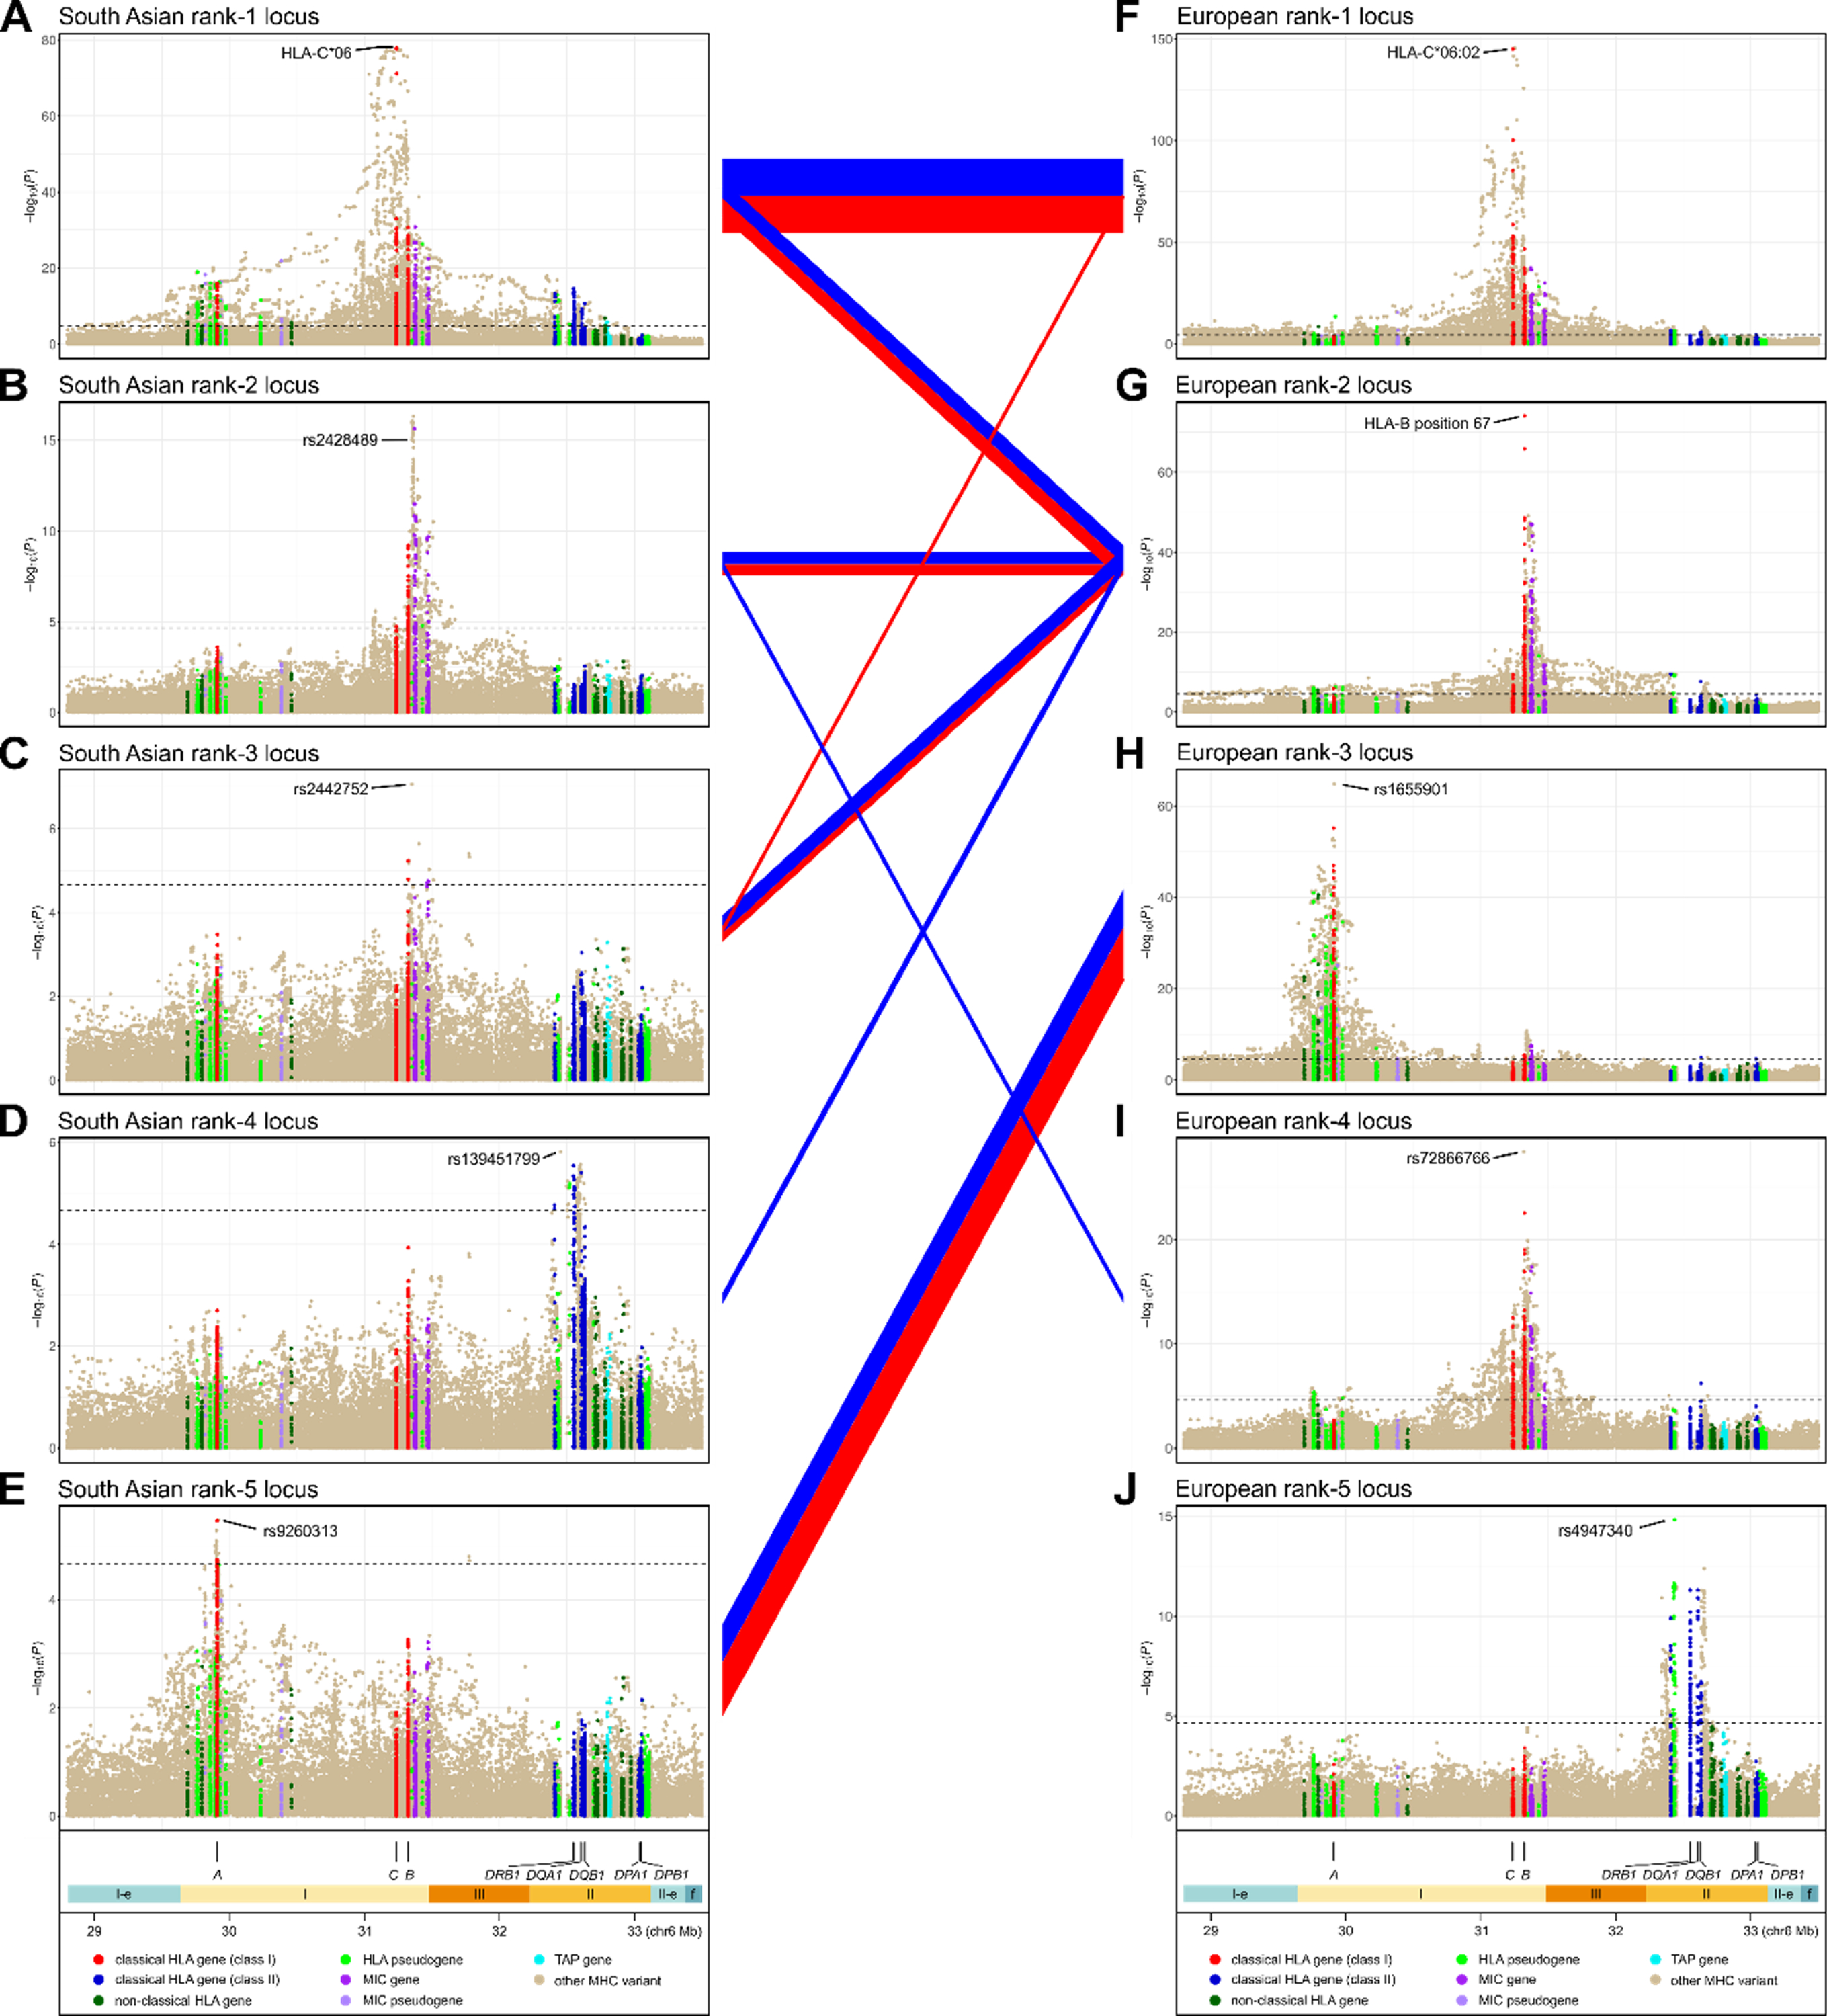
Figure 8. Linkage disequilibrium between the top five MHC association signals in the European and South Asian models.

Association plots for the five most significant psoriasis-associated MHC loci in South Asians (panels A–E) and Europeans (panels F–J) are shown in decreasing top to bottom order of their significance in the full regression model. Linkage disequilibrium (Wn2 coefficient) is depicted with line segments connecting pairs of South Asian and European loci; the color of the line indicates the population in which the LD was measured (red, South Asian; blue, European), and the thickness of the line is scaled linearly with the magnitude of LD. Only LD values of Wn2 ≥ 0.1 are shown.
