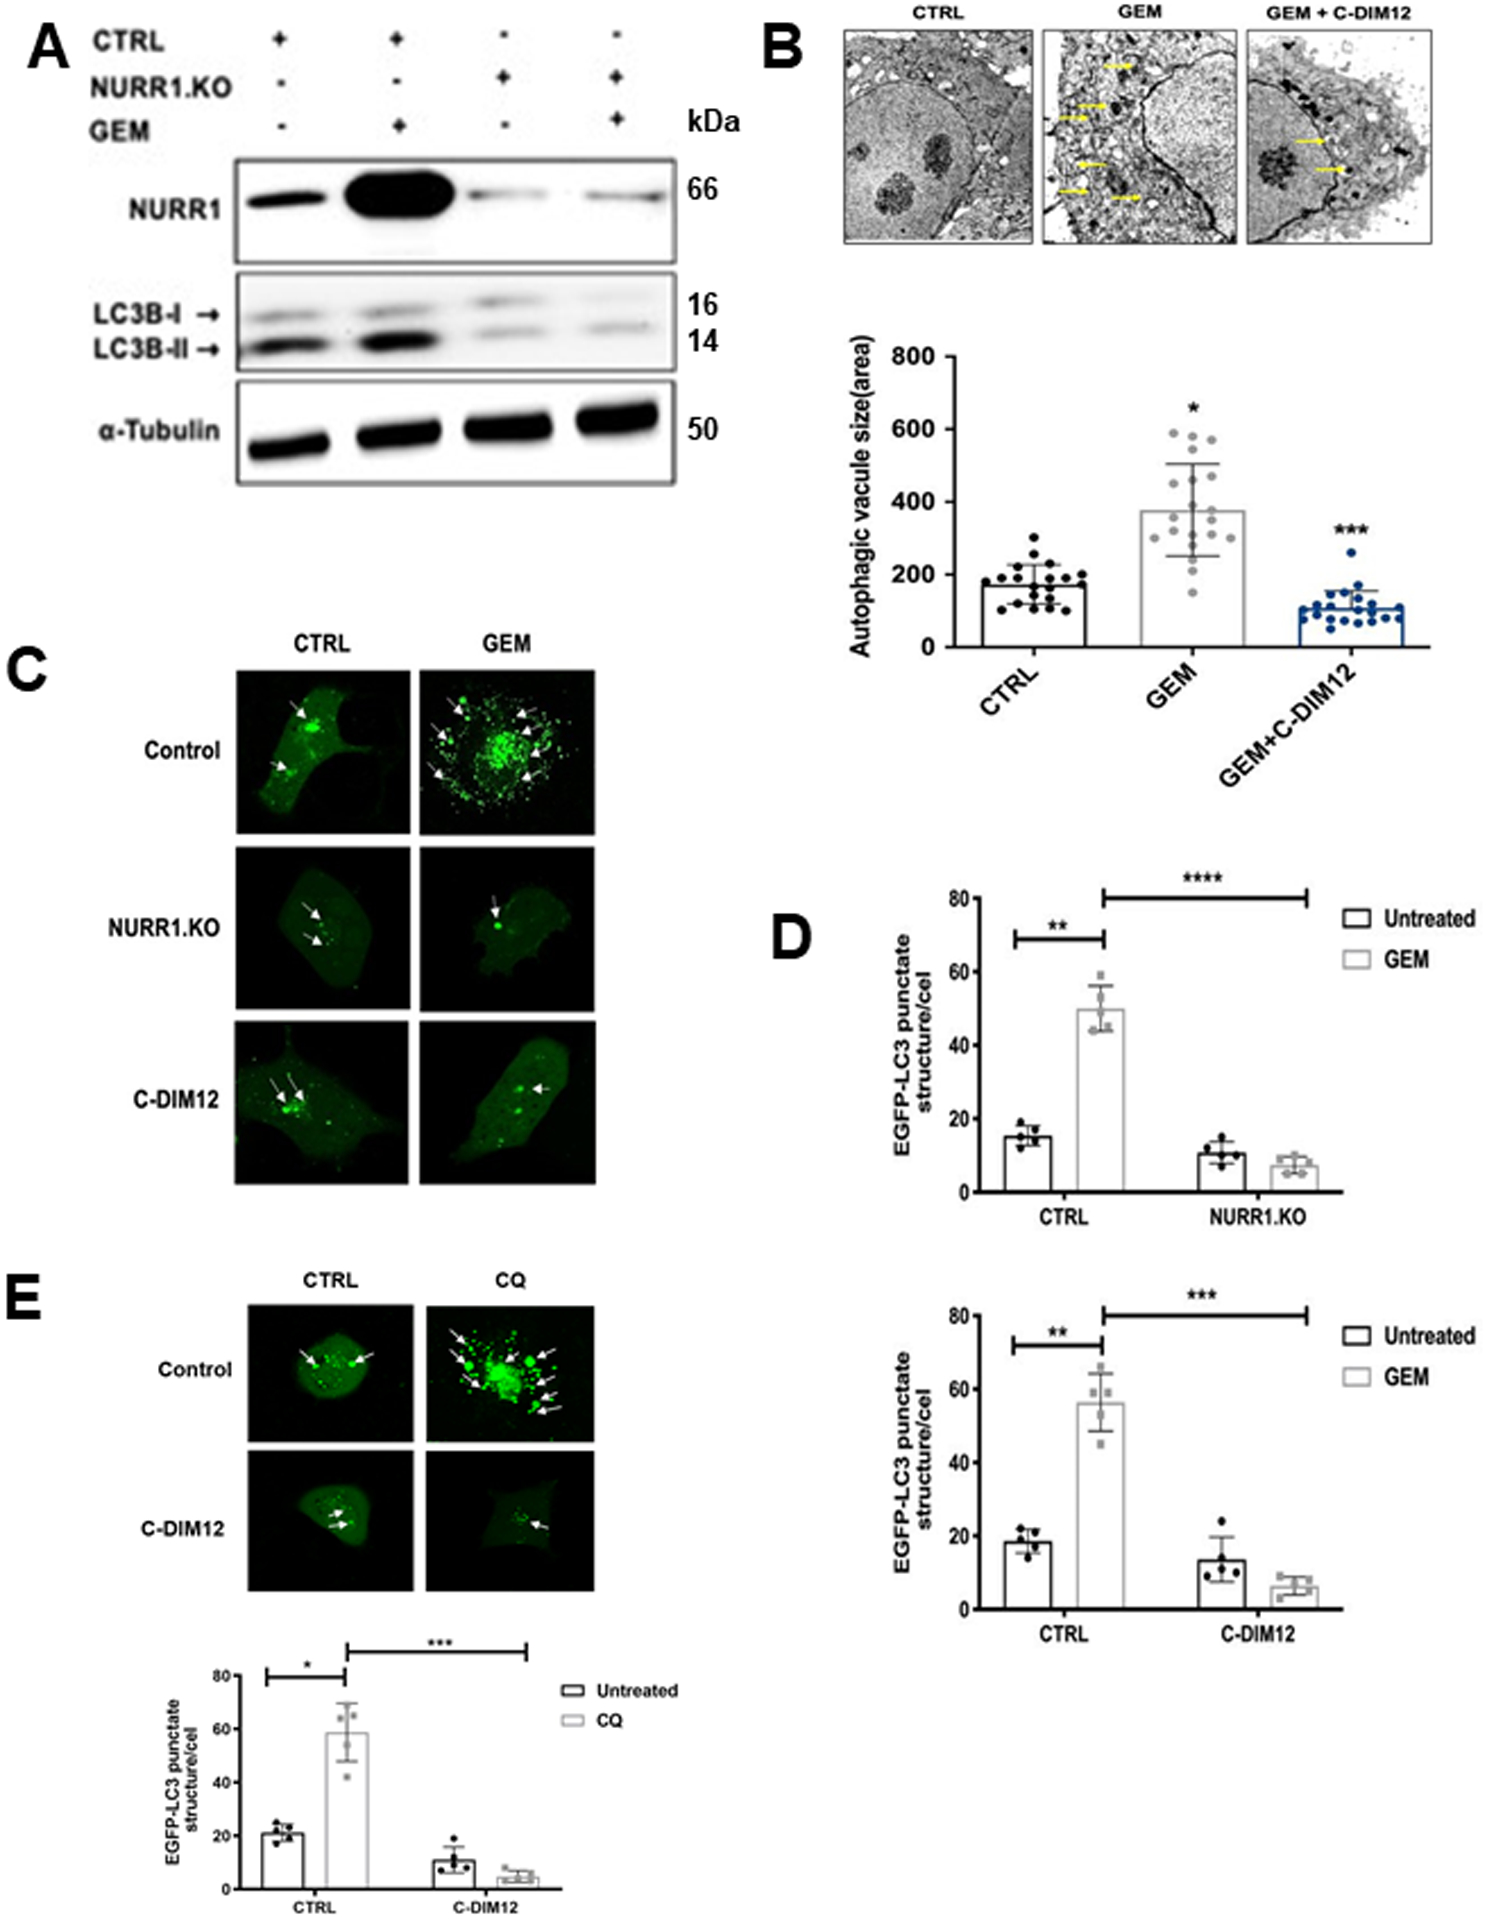
Figure 4. NURR1 induces autophagy in pancreatic cancer.

A) Immunoblot analysis of NURR1 and LC3-I and LC3-II in NURR1.KO cells compared to control (EV) MiaPaCa2 cells with α-Tubulin as loading control, B) MiaPaCa2 cells were treated with gemcitabine or C-DIM12 and autophagosomes were observed using transmission electron microscopy. The yellow arrow head indicates the autophagosomes and autolysosomes. The size of autophagosome was analyzed by measuring the area of autophagic vacuoles, C) Confocal microscopy images of MiaPaCa2 cells for EGFP-LC3 punctate staining in control (EV) and NURR1.KO cells treated with gemcitabine and C-DIM12 for 24 hours, white arrows indicate punctate EGFP-LC3 structures, D) and as a control experiment we show that chloroquine induces punctate screening E) Bar graphs representation of the average EGFP-LC3 punctate in the cells. * p < 0.05, ** p < 0.01, **** p < 0.0001. (3 independent experiments performed, and at least 10 images per slide were analyzed for each condition). Scale bar, 10 um. Magnification 40x.
