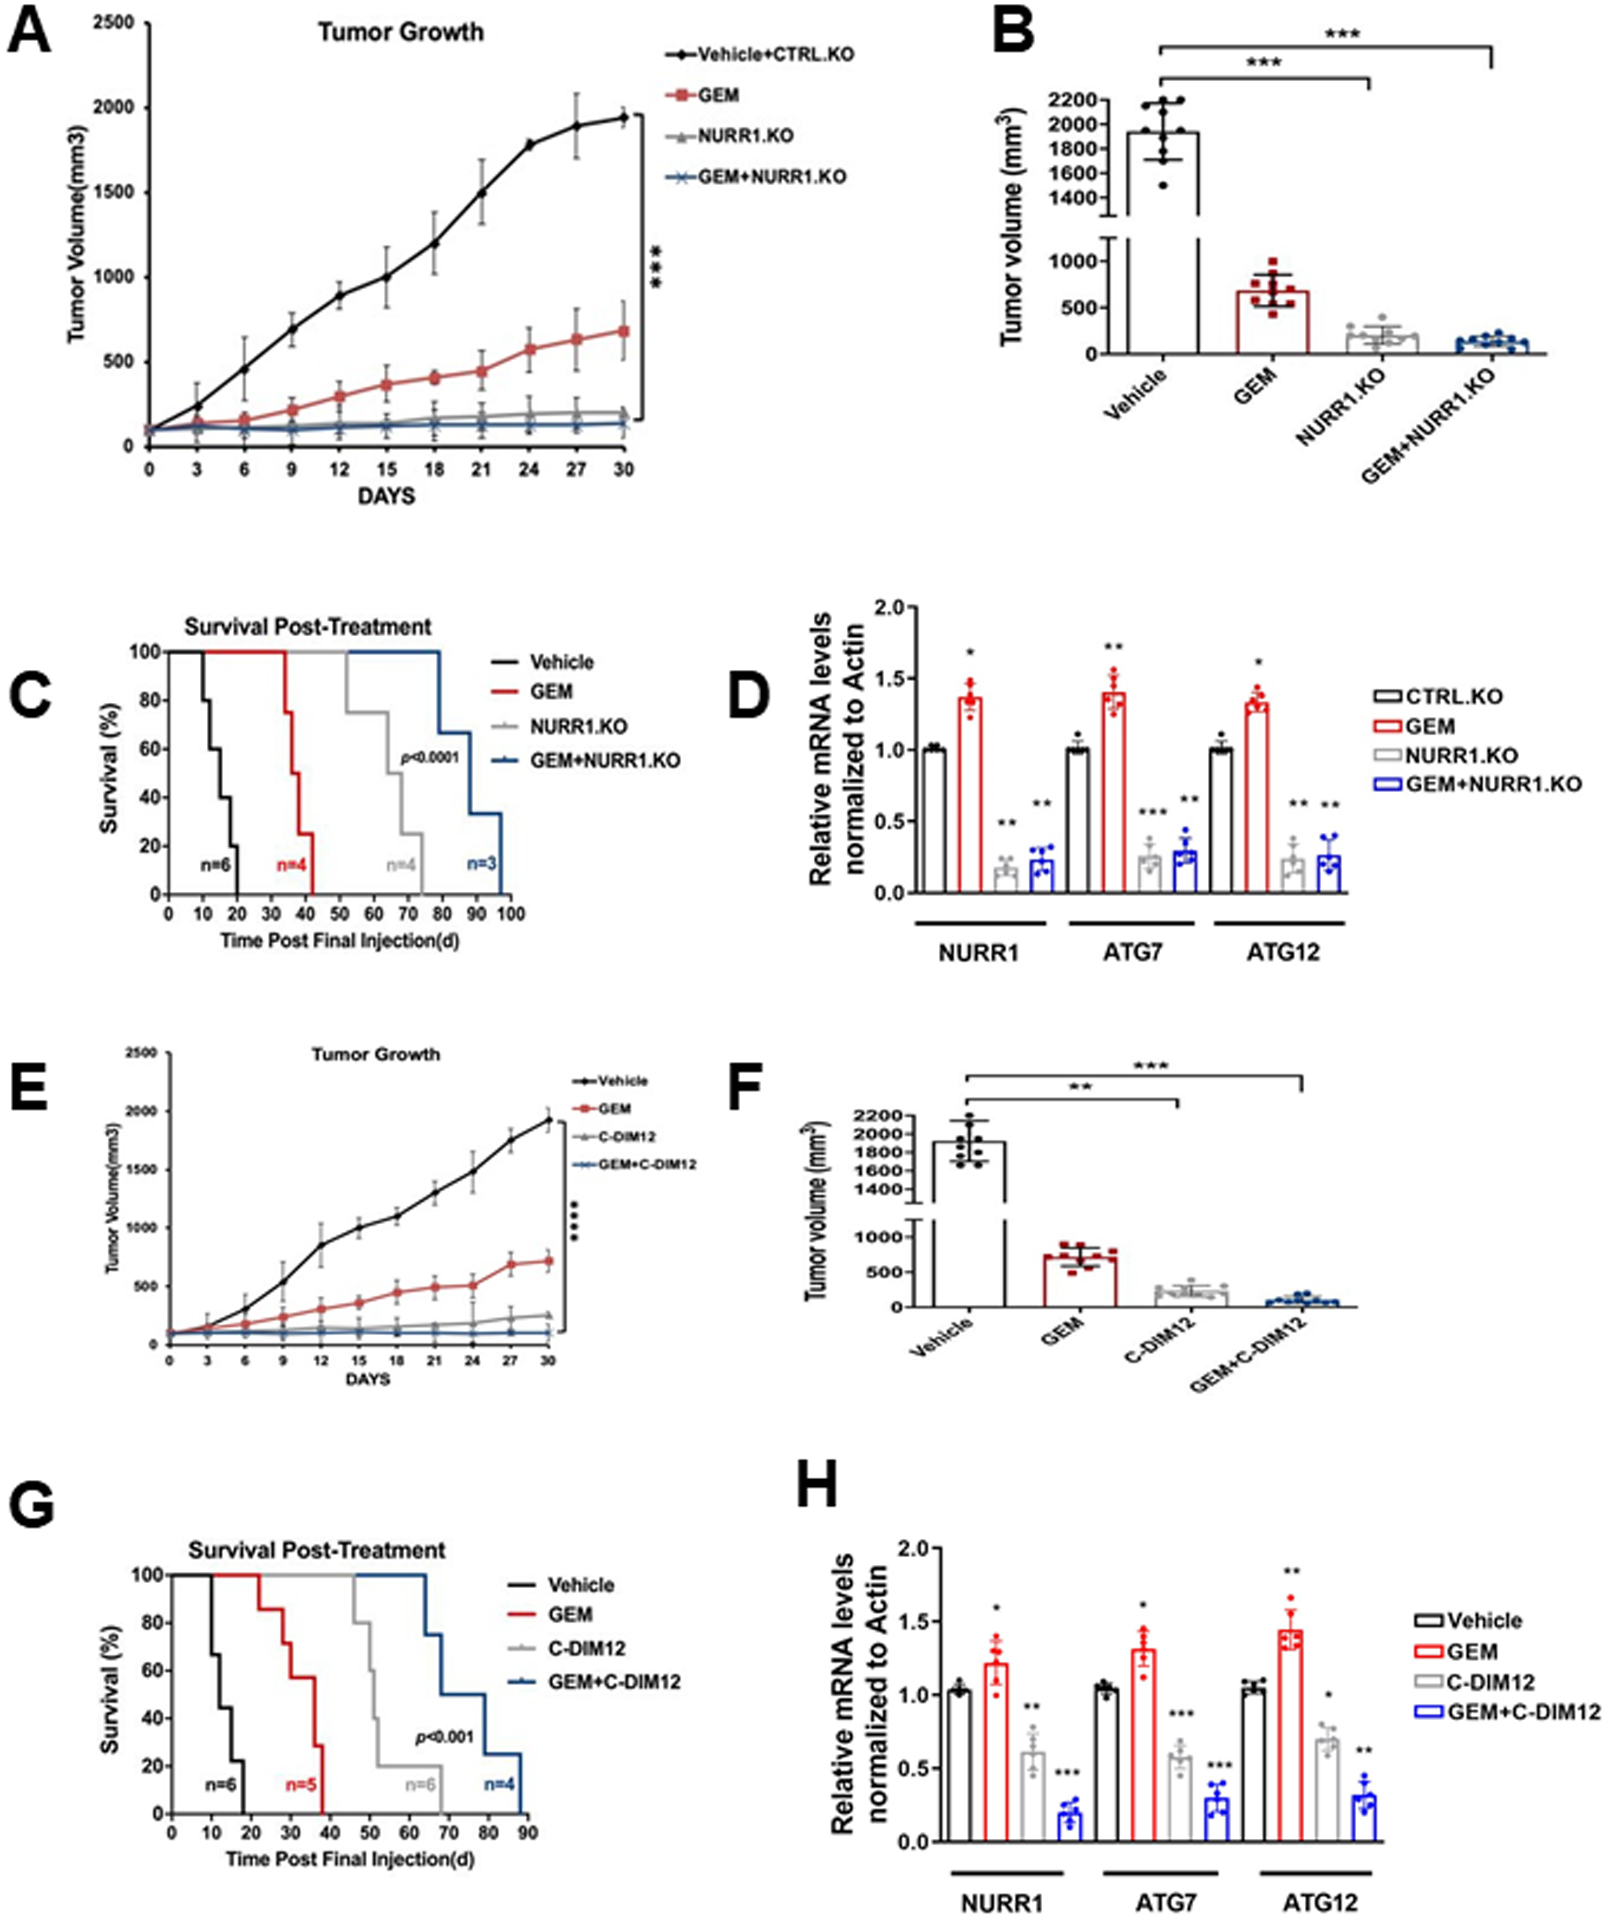
Figure 6. Gemcitabine in combination with C-DIM12 inhibits tumor growth in vivo.

A) Tumor growth curves of MiaPca2 CTRL and NURR1.KO xenografts in nude mice treated with vehicle, GEM, or combined NURR1.KO and GEM for 30 days, when control tumors reached 100 mm3 in size. Tumor size was assessed every 3 days using digital calipers. (n=5 per group, two tumors per mouse) (***p < 0.001). Mean and standard deviation are shown, B) Average tumor volume of MiaPaca2 (vehicle, GEM, NURR1.KO and combination of both) xenografts at the end of the experiment (day 30) (n=10 tumors per group), ***p < 0.001, C) Survival was assessed after gemcitabine cessation. Mice were removed from the group when tumors achieved a volume of 1500 mm3, statistical significance was determined by Log-rank test. D) Tumor RNA was extracted from vehicle or combination of GEM and NURR1.KO xenografts and analyzed for mRNA expression of NURR1, ATG7, or ATG12. Normalized values are shown as mean ± SEM (n = 6 tumors per group; **p < 0.01), E) Tumor growth curves of MiaPca2 xenografts in nude mice treated with vehicle, GEM, C-DIM or combined for 30 days (n=5 per group, two tumors per mouse) (**** p < 0.0001), F) Average tumor volume of MiaPacA2 (vehicle, GEM, C-DIM and combination of both) xenografts at the end of the experiment (day 30) (n=10 tumors per group), ** p < 0.01, ***p < 0.001, G) Survival was assessed after treatment cessation. Mice were removed from the group when tumors achieved a volume of 1500 mm3, statistical significance was determined by Log-rank test. H) Tumor RNA was extracted from vehicle or combination of GEM and C-DIM xenografts and analyzed for mRNA expression of NURR1, ATG7, or ATG12. β-actin was used as normalization control. Normalized values are shown as mean ± SEM (n = 6 tumors per group; *p < 0.05**p < 0.01).
