
Figure 1.
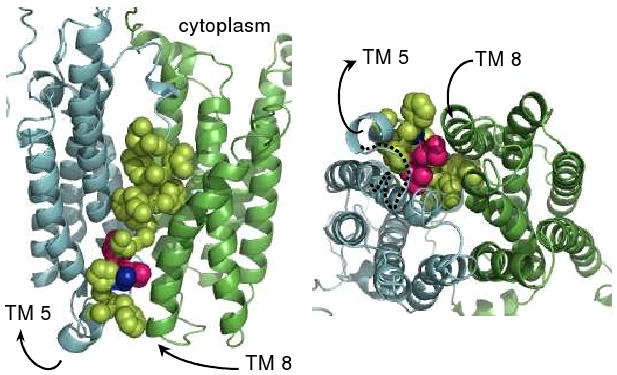
VAChT homology model. Left frame is a side view from inside the membrane and the right frame is a view from inside the synaptic vesicle looking through the bottom of the transport channel toward cytoplasm. The first cluster of six TMs is cyan and the second cluster is green. Not the entire homology model is visible. The arrows indicate the N- to C-terminal directions of TMs 5 and 8. Motif C is shown mostly in lemon-yellow as van der Waals spheres that cover the bottom two-thirds of TM 5. L226 and V227 are hot pink, and A228 is blue, even though they are part of Motif C. The dotted black line in the right frame traces Loop 5/6 from the end of TM 5 to the beginning of TM 6.