
Figure 4.
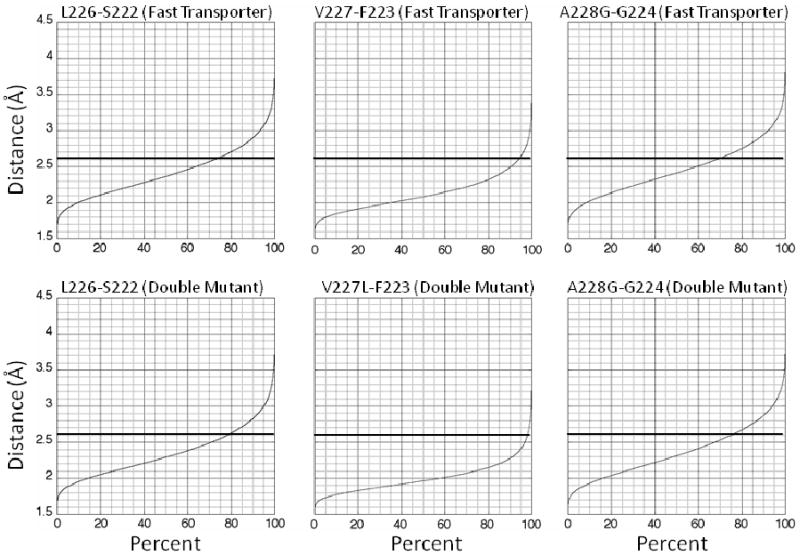
Distance of indicated amide protons to the carbonyl oxygen of the indicated residue versus cumulative percent of structures for mutant peptides. The maximal distance of 2.6 Å for hydrogen bonding is indicated by the dark horizontal lines. The top row of graphs is for α-helical interaction of L226, V227, and A228G in the fast-transporter peptide, and the bottom row is for α-helical interaction of L226, V227L, and A228G in the double-mutant peptide.