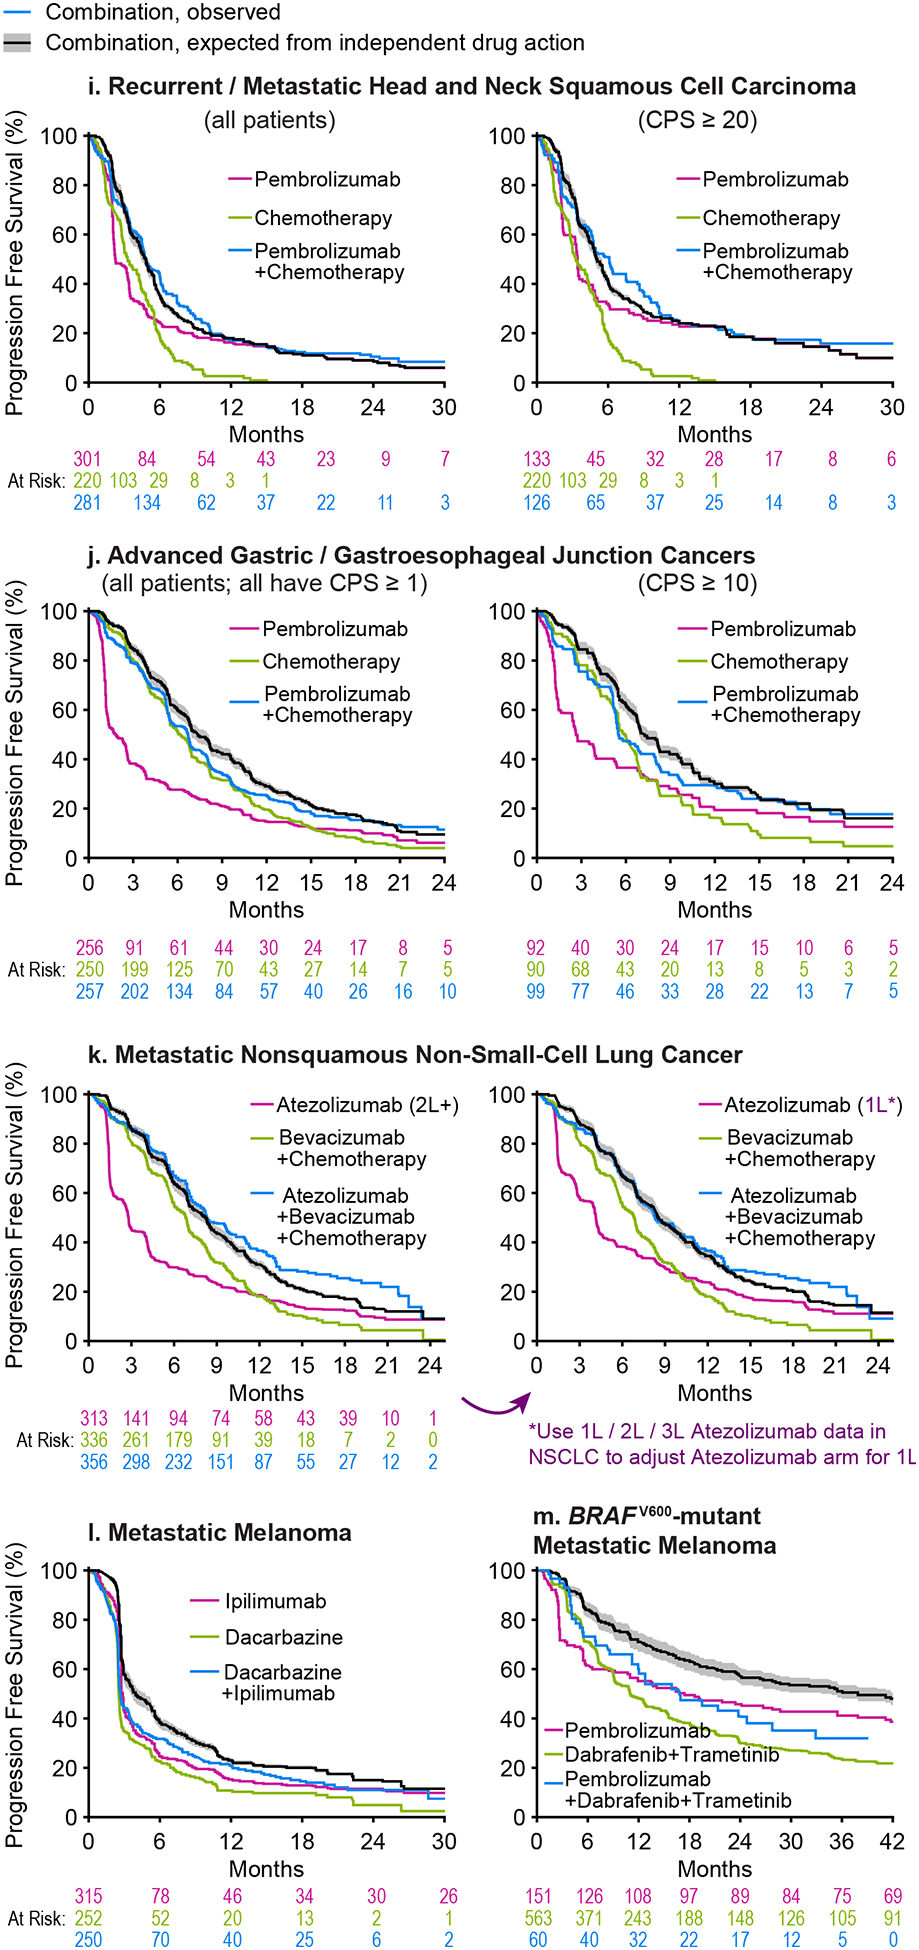
Figure 2. Progression Free Survival for combination therapies as observed in clinical trials and as predicted from independent activity of the therapies comprising the combination (Part 1).


Progression Free Survival (PFS) observed for each combination therapy (blue) was compared to that expected from the PFS distributions of the constituents of the combination (green and magenta) under the null hypothesis of independent drug action (black line and grey range, which reflects uncertainty in response correlation (ρ = 0.3 ± 0.2)). 2L and 2L+ indicate data from patients treated at second-line or later; all other data are from patients previously untreated for metastatic or advanced cancer. TPS: PD-L1 Tumor Proportion Score. CPS: PD-L1 Combined Proportion Score. Combination therapy data from: a CheckMate 067(31), b KEYNOTE-189(32), c KEYNOTE-407(33), d IMpassion130(36), e KEYNOTE-426(35), f JAVELIN Renal 101(34), g IMpower133(18) and CASPIAN(21), h IMpower130(38), i KEYNOTE-048(37), j KEYNOTE-062(22), k IMpower150(39) (note the difference between expected and observed PFS is significant for left panel and not for right panel; see Supplementary Figure 1), l NCT00324155(23). m KEYNOTE-022(24,40). Data sources, patient characteristics, and limitations are described in Supplementary Tables 1 and 2.
