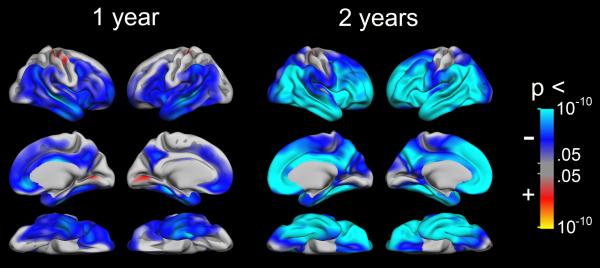
Figure 1. Cortical atrophy in healthy elderly.
General linear models were used to test whether rates of atrophy for one and two years were significantly different from zero. The results were thresholded by a conventional criterion for correction for multiple comparisons (false discovery rate < .05) and projected onto a semi-inflated template brain. Blue-cyan areas indicate cortical reduction, while red-yellow areas indicate expansion. As can be seen, significant volume reductions are found across large areas already after one year, and these were especially prominent in temporal and prefrontal areas.

