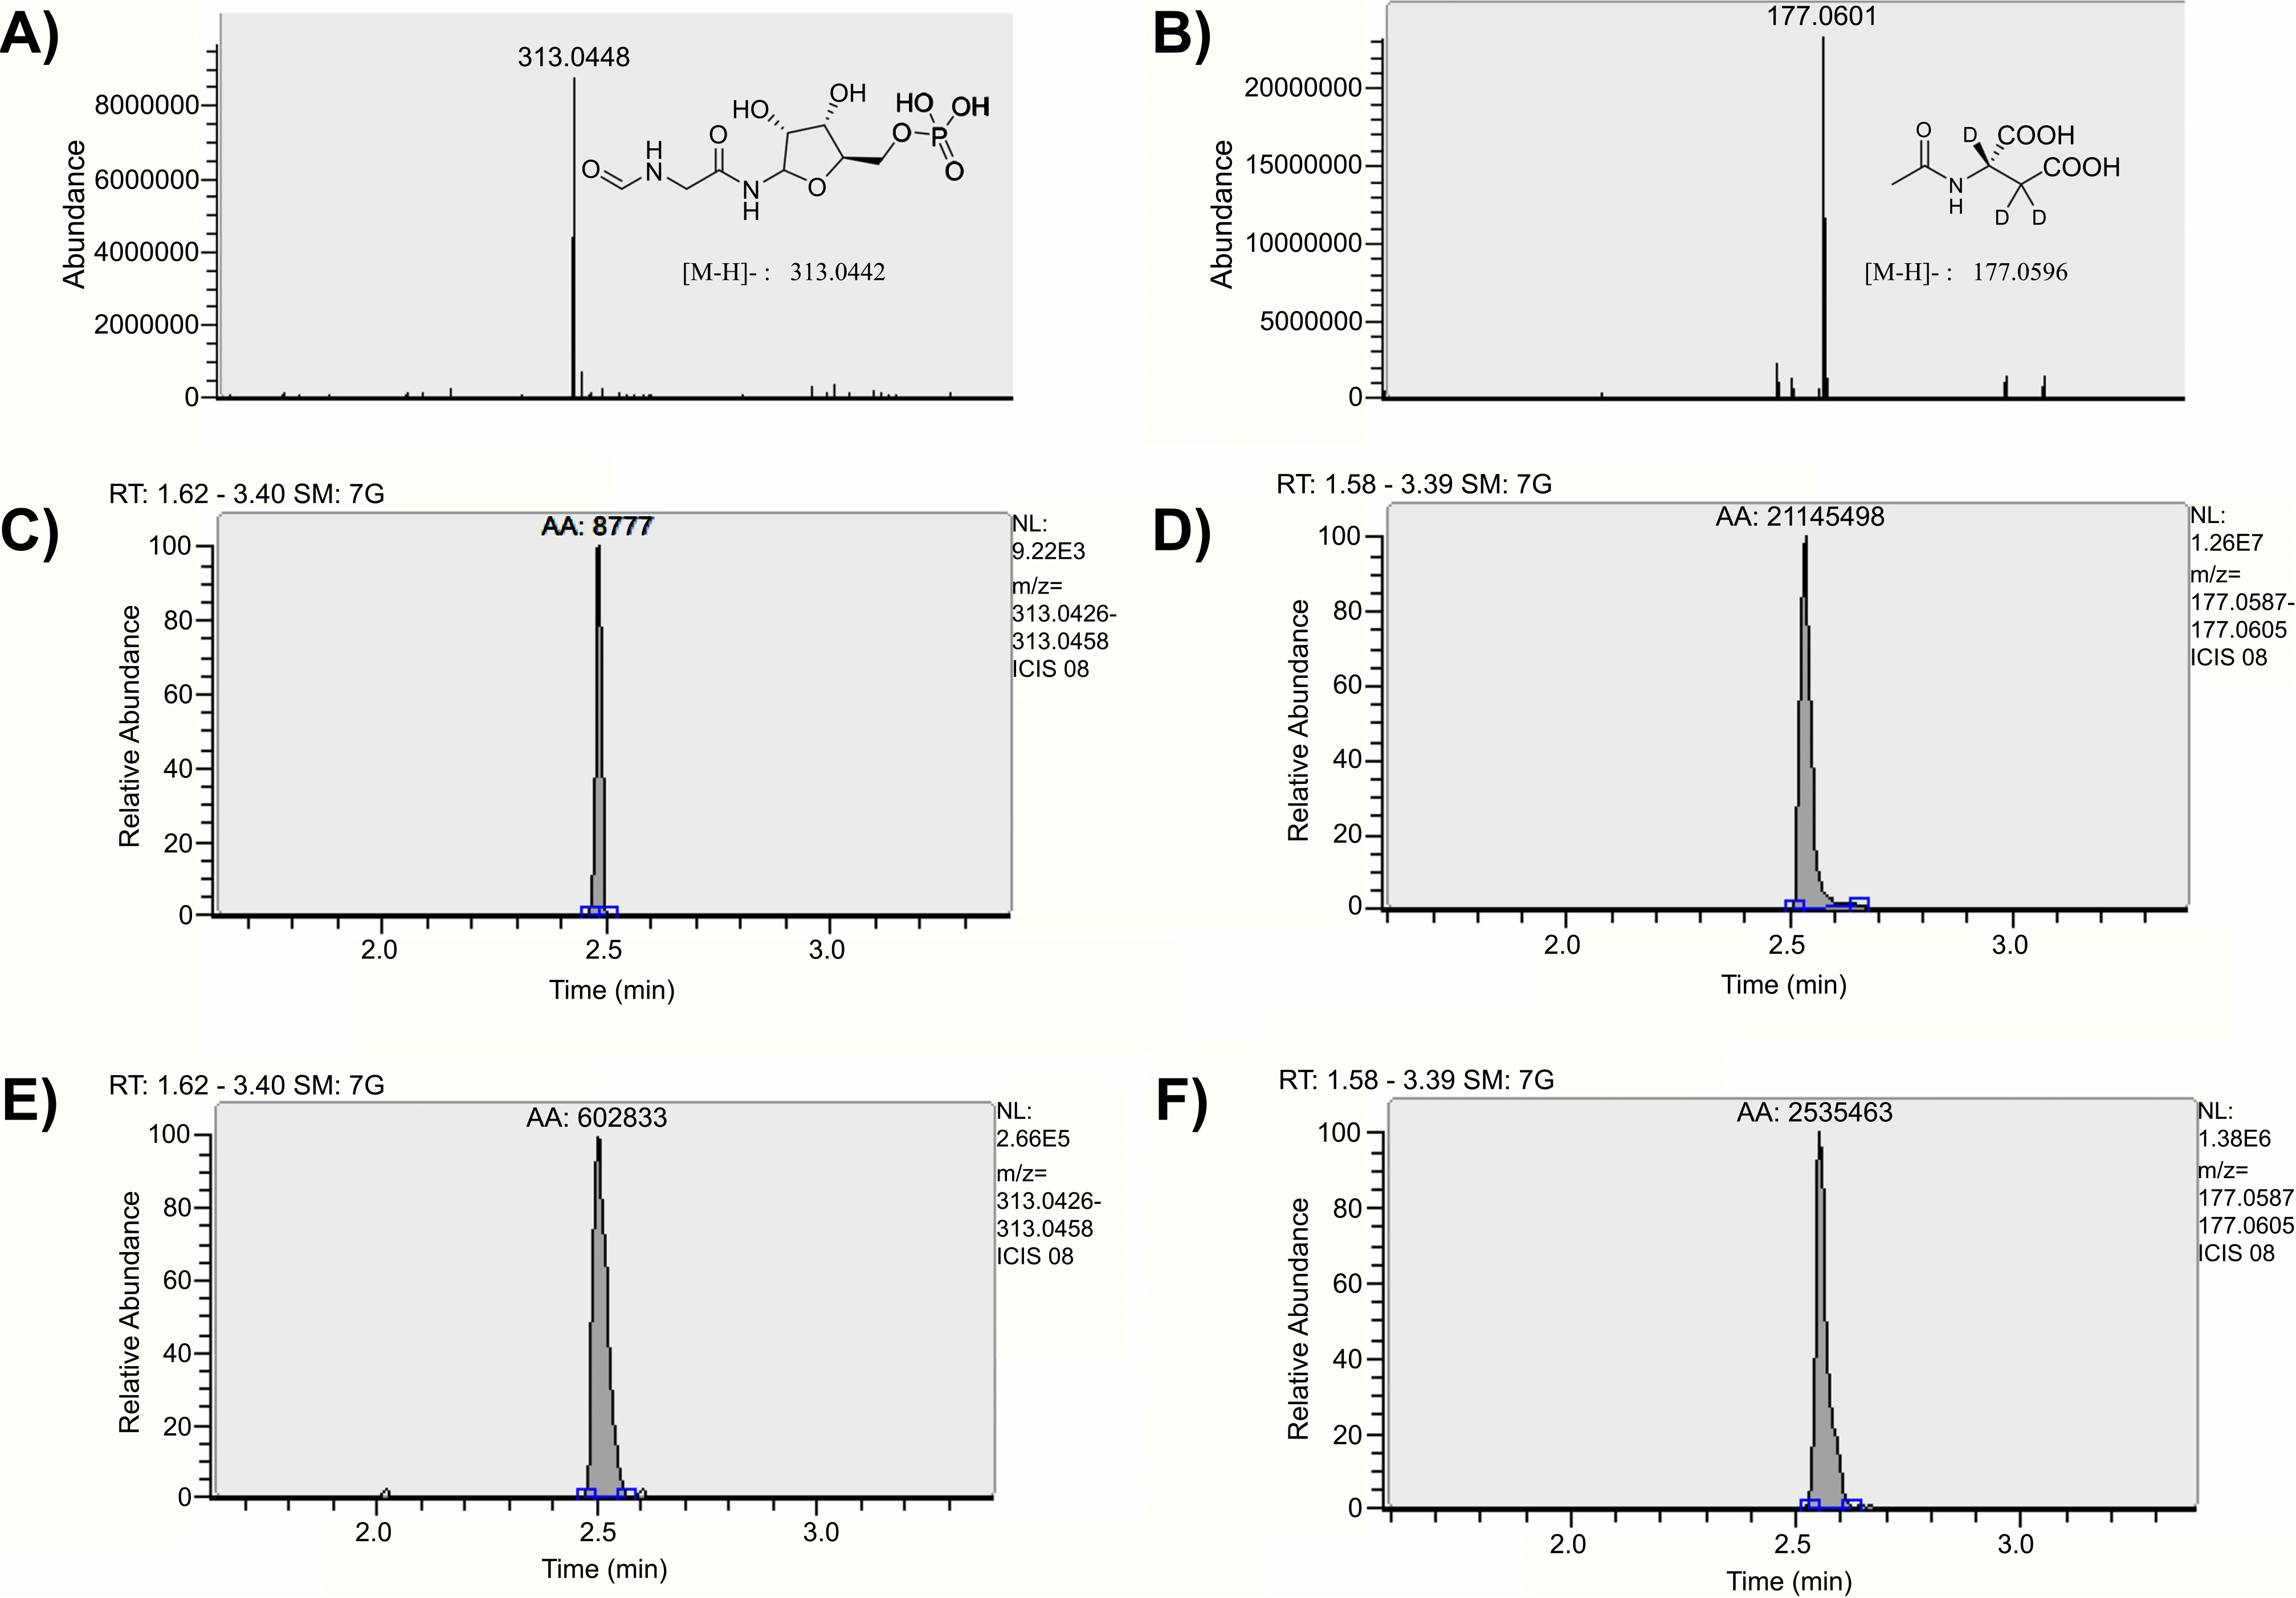
Fig. (4).

Representative high-resolution mass spectrum and chromatographic spectra of FGAR and IS. (A) High-resolution full scan mass spectrum of FGAR in negative mode with < 2 ppm error; (B) high-resolution full scan mass spectrum of internal standard (NAA-d3) in negative mode with < 2 ppm error; (C) extracted chromatogram of FGAR spiked in plasma at LLOQ (0.03 nmol/mL); (D) extracted chromatogram for internal standard (NAA-d3) in plasma; (E) extracted chromatogram of FGAR spiked in tumor at LLOQ (1 nmol/g); (F) extracted chromatogram for internal standard (NAA-d3) in EL4 tumor.
