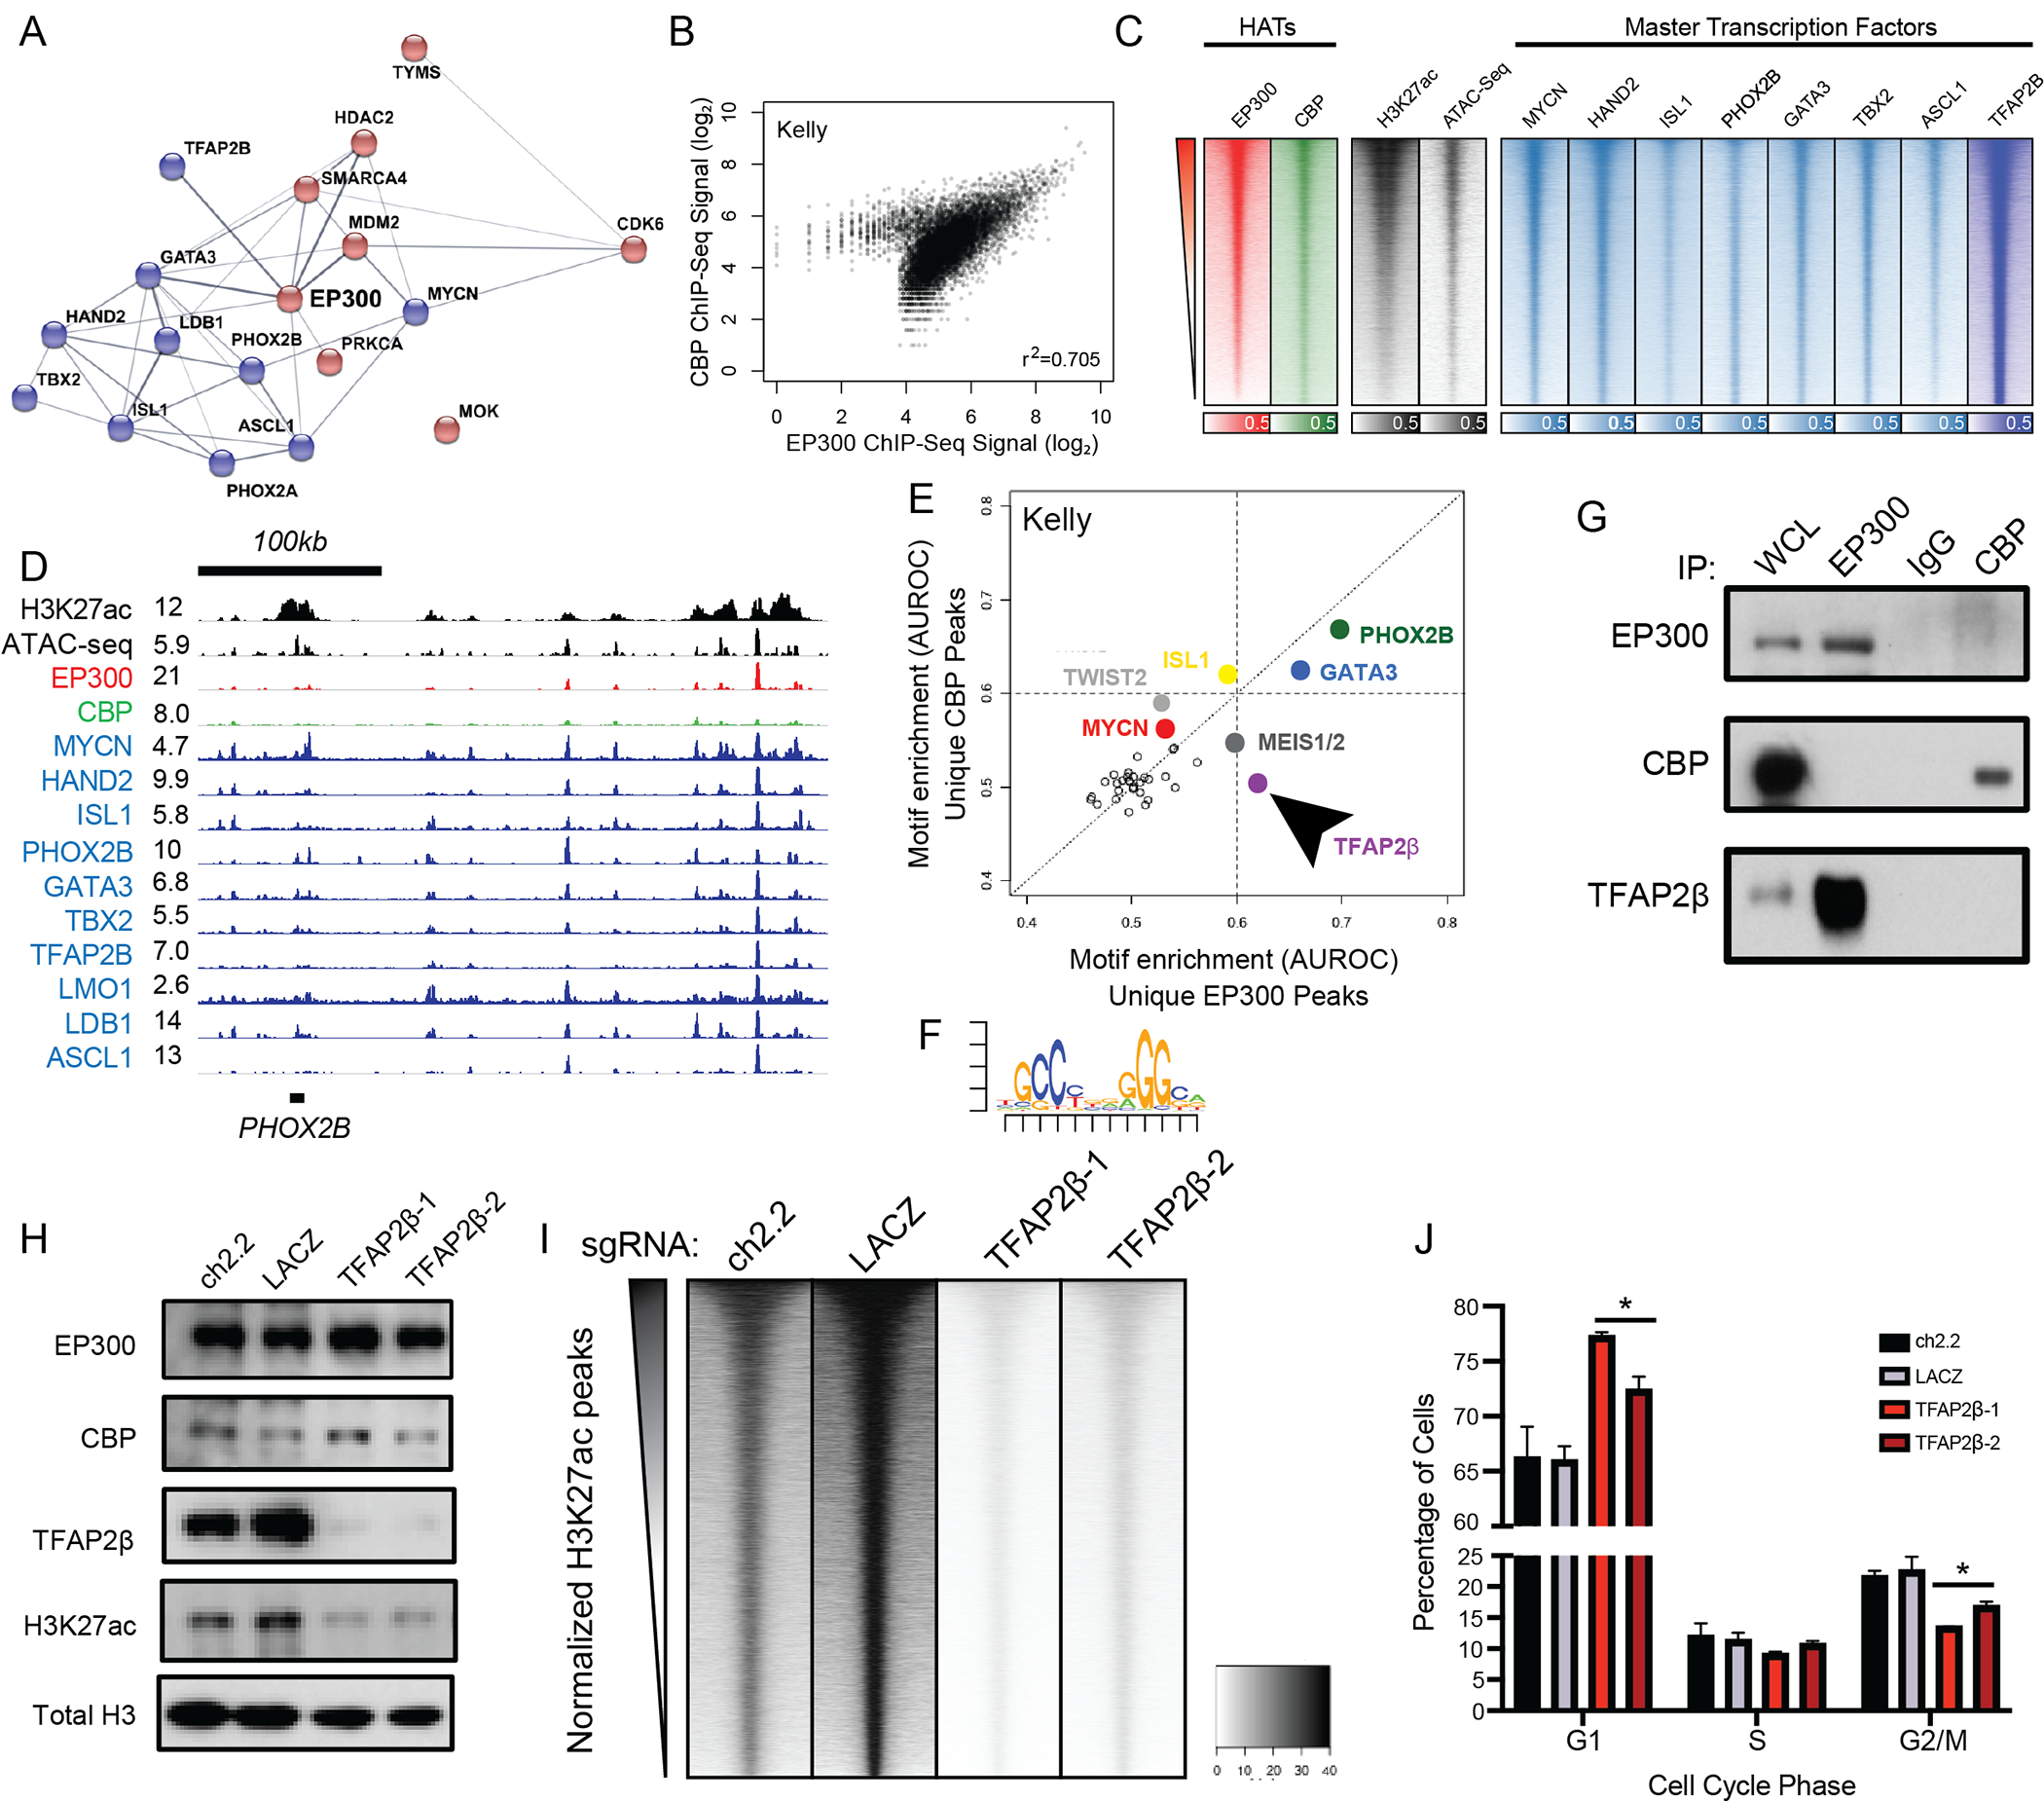
Figure 2. EP300 regulates the neuroblastoma core regulatory circuitry directed by TFAP2β.

A. STRING database interaction plot of nuclear dependency genes in NB cells. Data is derived from (9). Displayed are core regulatory circuitry transcription factors in blue and proteins with available targeting compounds in red. Connecting lines indicate previously demonstrated protein-protein interactions.
B. Scatterplot of log2 transformed read counts of EP300 or CBP ChIP-seq in the collapsed union of separately identified high-confidence CBP and EP300 binding sites in Kelly cells. R indicates the Spearman correlation coefficient demonstrating a strong linear relationship in coverage. Similar analysis in BE2C cells as Fig. S2A.
C. Genome-wide heatmap analysis of chromatin composition at the collapsed union of separately identified high-confidence CRC transcription factor-binding sites in Kelly cells. Rows ordered by EP300 signal. Similar analysis in BE2C cells as Fig. S2B.
D. Representative ChIP-seq plots demonstrating binding of CRC factors (blue), CBP (green), EP300 (red) at the PHOX2B core regulatory circuitry transcription factor locus in Kelly NB cells. Also shown is the PHOX2B super-enhancer (H3K27ac) and open chromatin (ATAC-seq) (black). Data is representative of both Kelly and BE2C cells and all CRC loci.
E. Motif enrichment analysis of ChIP-seq to EP300 and CBP in Kelly NB cells. Data was restricted to the top 500 bound peaks by EP300 or CBP in Kelly NB cells. Colored dots indicate known enriched transcription factors. Arrow indicates specifically enriched motif, corresponding to TFAP2β.
F. Position-weight matrix from analysis in D demonstrates the top enriched specific sequence under EP300 peaks, compared with CBP peaks, corresponding to the consensus binding sequence for TFAP2β.
G. Co-immunoprecipitation followed by western blotting analysis of EP300 and CBP in Kelly NB cells. WCL = whole cell lysate. IgG = isotype-matched rabbit IgG antibody. Data is representative of three independent co-IP-western blots.
H. Kelly NB cells expressing Cas9 were infected with sgRNAs targeting TFAP2β (TFAP2β−1,2) or control loci (ch2.2, LACZ), followed by western blotting to the shown targets. Data is representative of three independent lysates and blots.
I. Genome-wide heatmap analysis of H3K27ac coverage in wild-type and TFAP2β-knockout Kelly cells using cell number- and E.coli-spike-in normalized CUT&RUN-sequencing. Rows represent 6kb regions centered on the center of the collapsed union of high-confidence peaks separately identified in each condition and are ordered by control (ch2.2) signal.
J. Propidium-iodide flow cytometry of Kelly NB cells expressing Cas9 and infected with sgRNAs targeting TFAP2β (TFAP2β−1,2) or control loci (ch2.2, LACZ). n=3 independent infections and flow analyses. * p<0.05. Bars represent S.E.M. See also Fig. S2.
