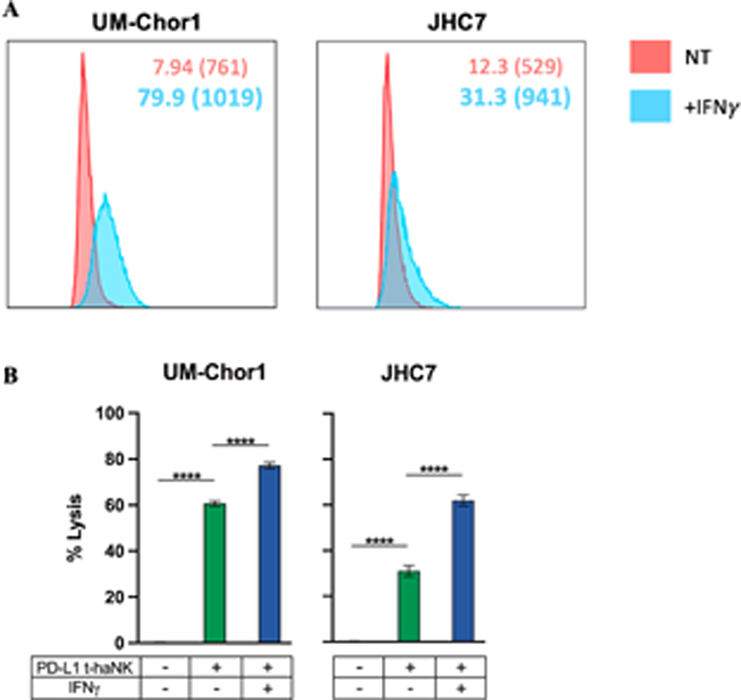
Fig. 6. PD-L1 t-haNK cells induce lysis of chordoma cell lines through a PD-L1-mediated mechanism.
Two chordoma cell lines (UM-Chor1, JHC7) were used as targets for PD-L1 t-haNK cells in 111In-release killing assays. (A) Chordoma cells were analyzed by flow cytometry for PD-L1 expression after 24-hour co-incubation with IFNγ on the same day as killing assays. Cell surface expression of PD-L1 quantified by flow cytometry is reported in % positive cells and MFI. Bold values denote an increase of > 30% relative to untreated control cells. (B) Chordoma cells were co-incubated with IFNγ or left untreated as controls for 24 hours before being used as targets for PD-L1 t-haNK cells. All E:T ratios are 20:1. Statistical analyses were done by one-way ANOVA with Tukey’s multiple comparisons test. *P ≤ 0.05, **P ≤ 0.01, ***P ≤ 0.001, ****P ≤ 0.0001. Results shown are the means ± SEM of technical triplicate measurements and are representative of three independent experiments.

