Fig. 3.
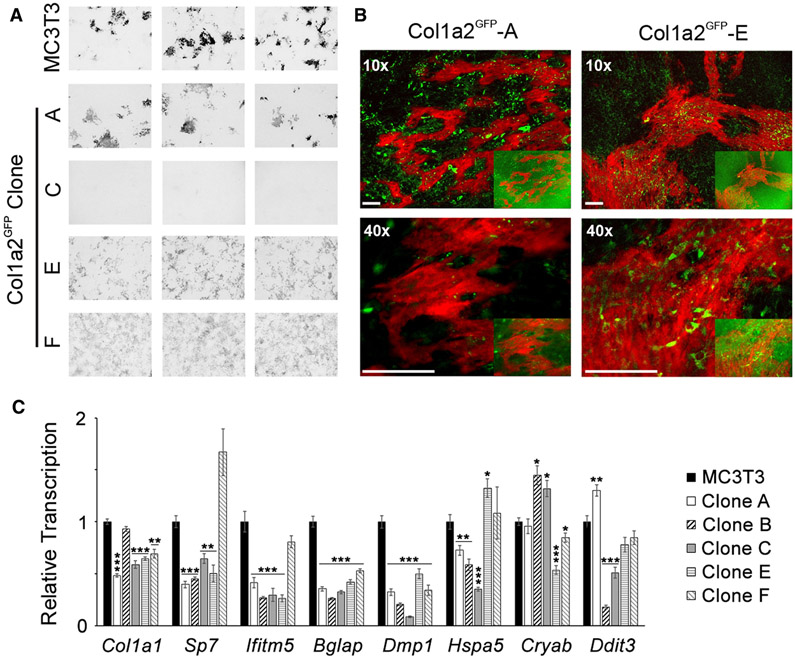
Osteoblastic differentiation of Col1a2GFP cells. a Low-resolution (10 μm/pixel) images of extracellular matrix (ECM) in cell culture plates (8-week culture with 100 μM Asc2P and 2.5 mM βGP) after mineral labeling with Alizarin Complexone (N=3 wells for each clone). Given identical appearance of no mineral (no Alizarin Complexone staining) in clones B–D, only clones A, C, E, and F are shown. Multiple mineralization nodules (dark areas) are observed in unedited MC3T3 cells and Col1a2GFP clones A, E, and F. b Higher-resolution images of mineralization nodules in clones A and E, showing localization of primarily intracellular GFP-proα2(I) (green) relative to mineralized ECM (red). Insets and main panels are the same images before and after removal of background ECM fluorescence by a Gaussian blur (σ=70) filtering of the GFP channel. Scale bars = 100 μm. c Relative transcription of Col1a1, osteogenic (Sp7, Ifitm5, Bglap, and Dmp1) and cell stress (Hspa5, Cryab, and Ddit3) genes after 8 weeks with 100 μM Asc2P and 2.5 mM βGP in the ECM mineralization experiment (2−ΔΔCT with Hprt1 and B2m used as endogenous controls). Error bars show SEM (N=3 wells); * p < 0.05, ** p < 0.01, *** p < 0.001.

