
Figure 4.
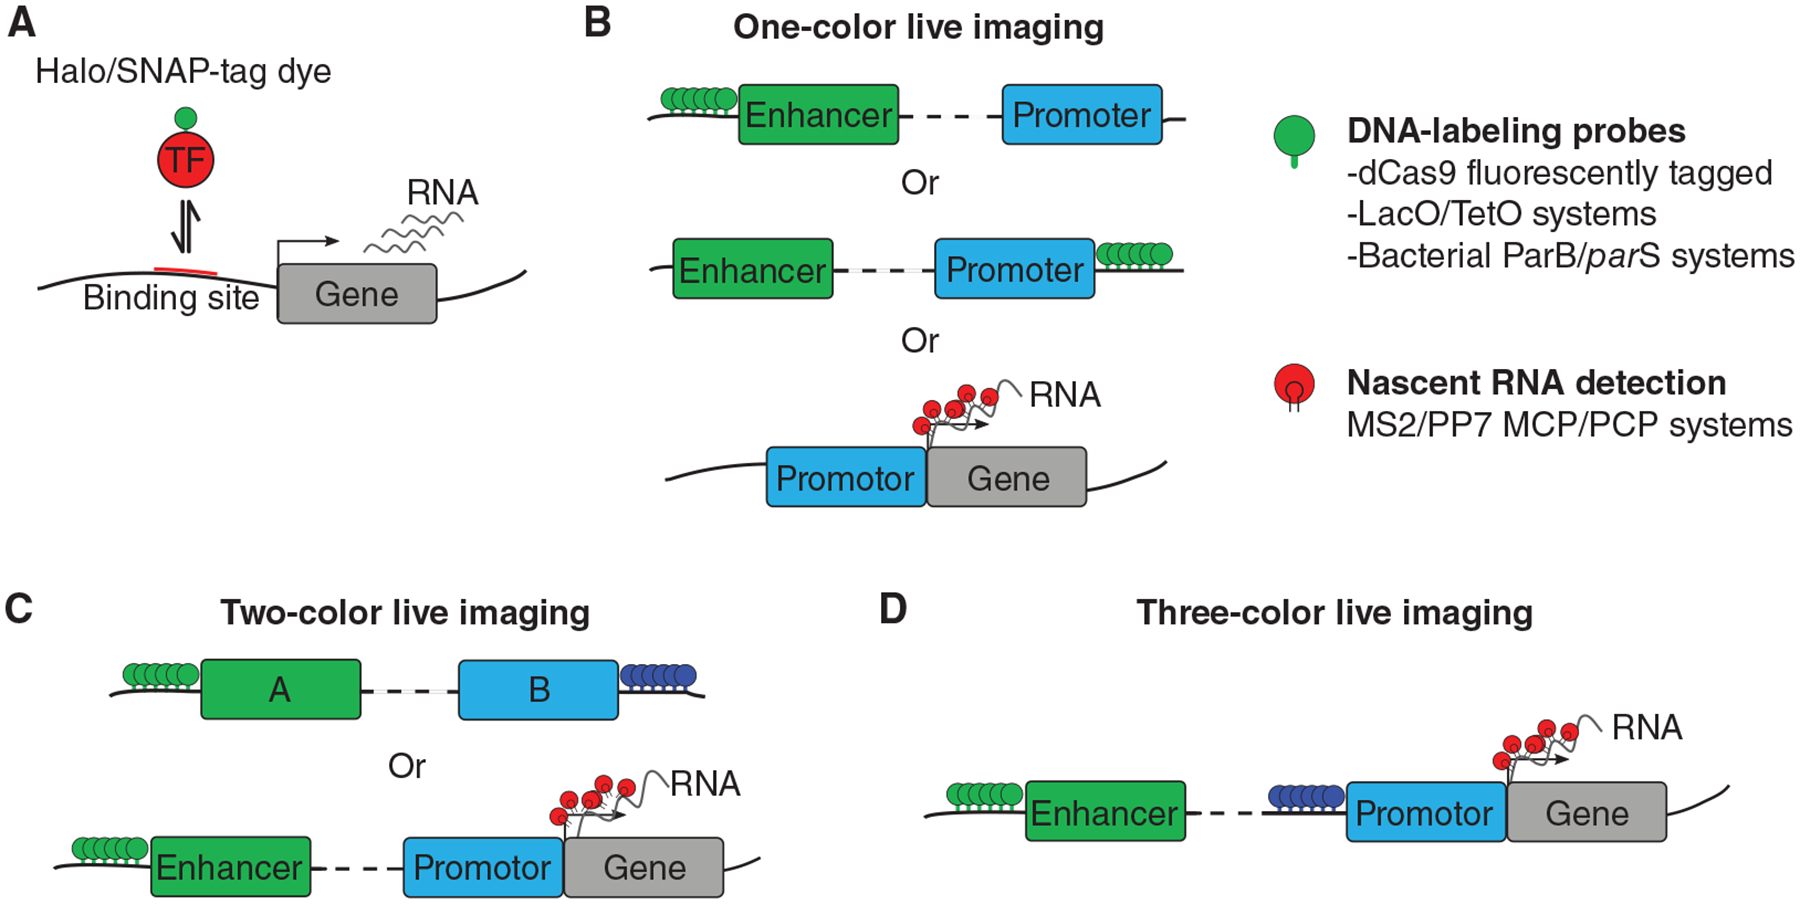
Imaging genome and transcriptional dynamics in living cells. (A) Transcription factor dynamics monitored via two labeling strategies: fluorescent proteins or Halo/SNAP-tags coupled with dyes. (B) Strategies for fluorescent imaging of DNA and RNA in living cells. Several labeling approaches have facilitated imaging of chromosome dynamics in a sequence-specific manner: fluorescently tagged catalytically inactive cas9 enzymes (dCas9), fluorescently labeled operator binding protein (TetR, LacI), and the bacterial multimerizing ParB/parS system. (C) Two-color live imaging is used to simultaneously monitor the dynamics of two chromosomal regions or enhancer–promoter dynamics coupled with nascent transcription by using a combination of approaches shown in B. (D) Three-color live imaging allows probing for functional proximity: two colors for tagging enhancer–promoter pairs for example and one color for active transcription.