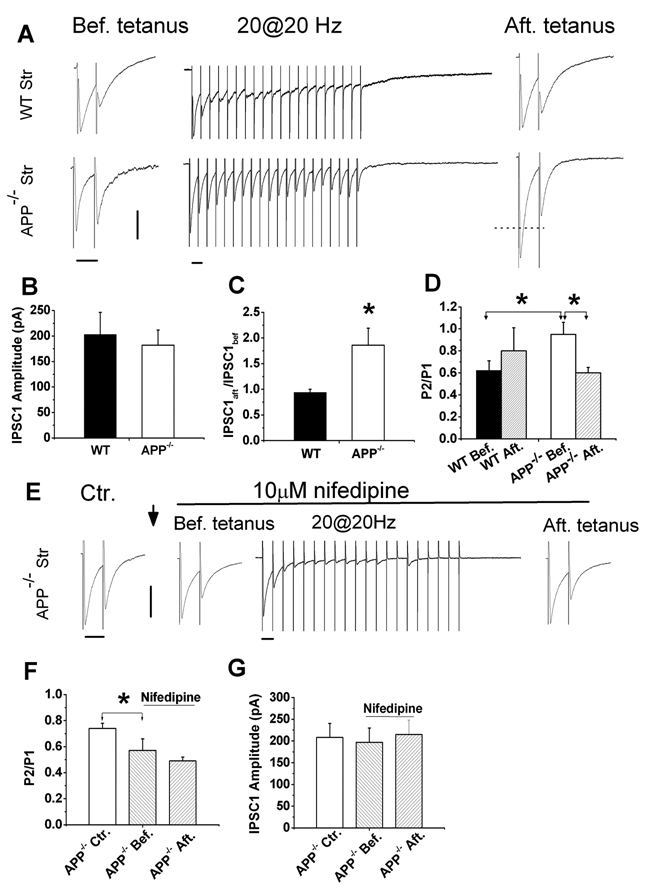
Figure 3.
Altered STP in APP−/− striatal GABAergic synapses and normalization of STP by LTCC blocker nifedipine. A. Representative traces of WT and APP−/− striatal neurons in response to paired-pulse (before tetanus), tetanus (20 Hz, 1 sec) and after tetanus paired-pulse stimulation. B. Similar IPSC1 amplitude in the presence of CNQX and APV in APP−/− striatum (N=20) compared to WT controls (N=12). C. The ratio of IPSC1 amplitude after tetanus (IPSC1aft) vs. before the tetanus (IPSC1bef) in APP−/− striatal (N=18) and WT controls (N=12). D. Paired-pulse ratio (P2/P1) before and after tetanic stimulation in WT [WT Bef., 0.62±0.09 (N=15); WT Aft., 0.82±0.21 (N=6)] and APP−/− [APP−/− Bef., 0.95±0.11 (N=17); APP−/− Aft., 0.6±0.05 (N=12)]. E. Representative traces showing paired-pulse response in the absence of nifedipine (Ctr.), in the presence of nifedipine before train stimulation (Bef. tetanus), during the train (20@20 Hz) and after the train stimulation (Aft. tetanus). ↓: indicating 15 min application of 10 µM nifedipine. F. Paired-pulse ratio (P2/P1) in APP−/− striatal cultures in the absence [Ctr., 0.74±0.04 (N=6)] and presence of nifedipine (before and after tetanus) (Bef., 0.57±0.09; Aft. 0.49±0.03 (N=6)]. G. IPSC1 amplitude in the absence (Ctr) and presence of nifedipine in APP−/− hippocampal cultures (before and after tetanus). Data shown as mean ± SEM. Scales: 100 pA/50 msec. *p<0.05.

