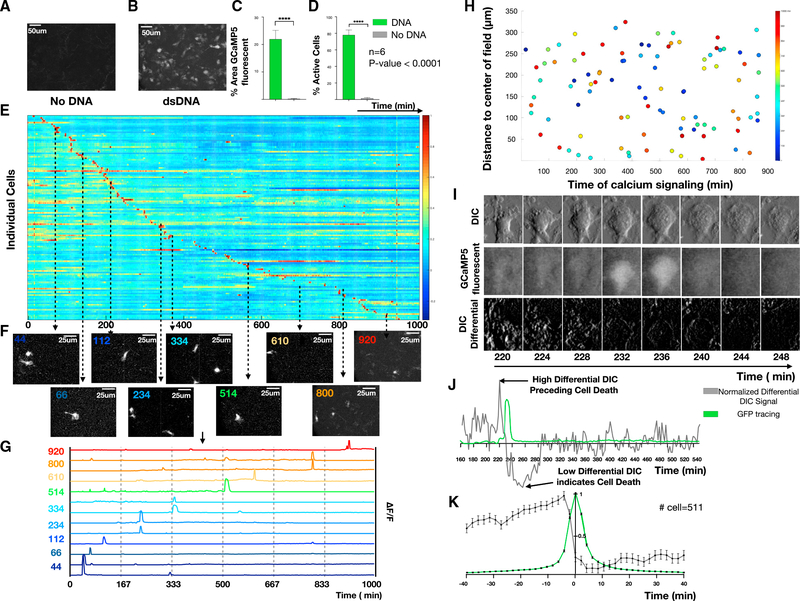
Figure 1. Calcium reporter macrophages reveal the dynamics of fatal DNA-induced calcium overload.
(A and B) BMDMs were exposed to immune-stimulatory dsDNA or vehicle control and live cell imaging was performed to quantify the resulting calcium signals every 2 min for 16 h. MIPs of representative time-lapse images for (A) no DNA compared with (B) dsDNA.
(C and D) (C) Quantification of percentage of GCaMP signaling area and (D) percentage of active cells comparing no DNA with DNA (n = 6).
(E) Heatmap of normalized calcium fluorescence versus time for each single cell over 16 h.
(F) Example images at discrete time points illustrating asynchronous transient calcium reporter fluorescence.
(G) Quantification of the fluorescence dynamics of the cells shown in (F).
(H) Spatial location of single cells with color indicating the timing of cellular calcium-dependent fluorescence calcium elevations.
(I) DIC (top), GFP (middle), and differential DIC (bottom) surrounding a single calcium overload event.
(J) Example quantification of normalized differential DIC signal (gray) with low differential DIC indicating a lack of cell movement suggesting cell death.
(K) Stereotyped dynamics of differential DIC signals (gray) and calcium-dependent fluorescence (green) surrounding each calcium overload event (n = 511).

