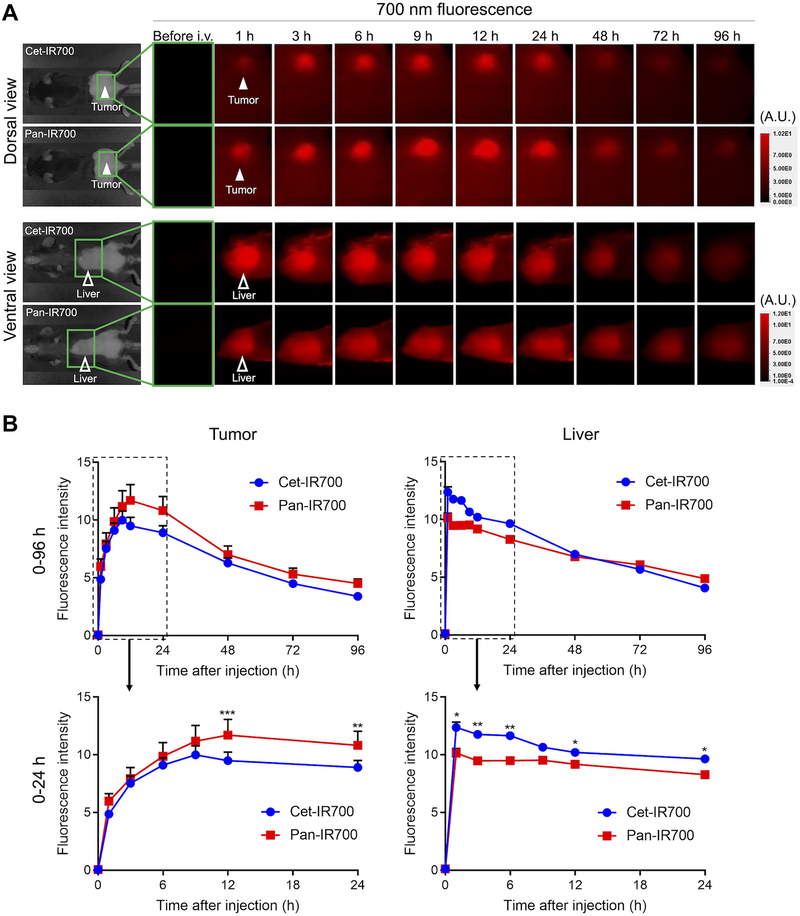
Fig. 2. Fluorescence imaging study.
A, Serial 700-nm fluorescence images were obtained after intravenous injection of each APC. Tumor and liver were assessed with dorsal and ventral view, respectively. Filled arrowhead, tumor; open arrowhead, liver. B, Mean fluorescence intensity was compared between two APCs. Upper, graphs of all time points (0–96 h after the injection); lower, magnified graph of the early phase (0–24 h after the injection) (n = 7; repeated measures two-way ANOVA followed by Sidak’s test; *, p < 0.05; **, p < 0.01; ***, p < 0.001).

