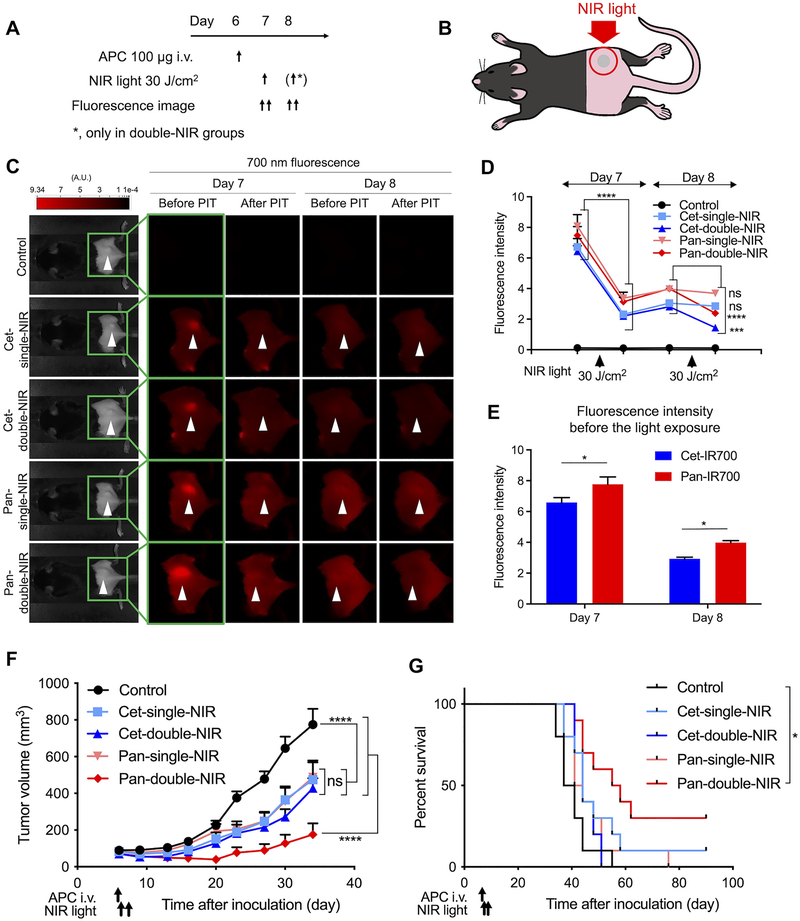
Fig. 3. In vivo NIR-PIT.
A, Treatment and imaging schedule. In cet-single-NIR and pan-single-NIR groups, NIR light was applied only once on one day after the APC injection, while in cet-double-NIR and pan-double-NIR groups, the light was exposed on the following two days after the APC injection. B, Diagram of NIR light exposure. Tumor was established on the right dorsum and NIR light was applied only to the tumor; all other parts of the body were covered with aluminum foil during the light exposure. C, Fluorescence images were obtained before and after the light exposure on the two days on which NIR light was exposed. Arrowheads represent the location of tumors. D, Quantitative analysis of the fluorescence intensity of tumor region. (n = 10; repeated measures two-way ANOVA followed by Tukey’s test; ***, p < 0.001; ****, p < 0.0001, ns, not significant). E, Tumor fluorescence intensity before the light exposure was compared between cet-IR700 (cet-single-NIR and cet-double-NIR groups) and pan-IR700 (pan-single-NIR and pan-double-NIR groups) groups on each treatment day (n = 20; two-way ANOVA followed by Sidak’s test; *, p < 0.05). F, Tumor volume curves (n = 10; repeated measures two-way ANOVA followed by Tukey’s test; ****, p < 0.0001, ns, not significant). G, Survival curves based on the tumor volume (1,000 mm3) (n = 10; log-rank test with Bonferroni correction; *, p < 0.05).

