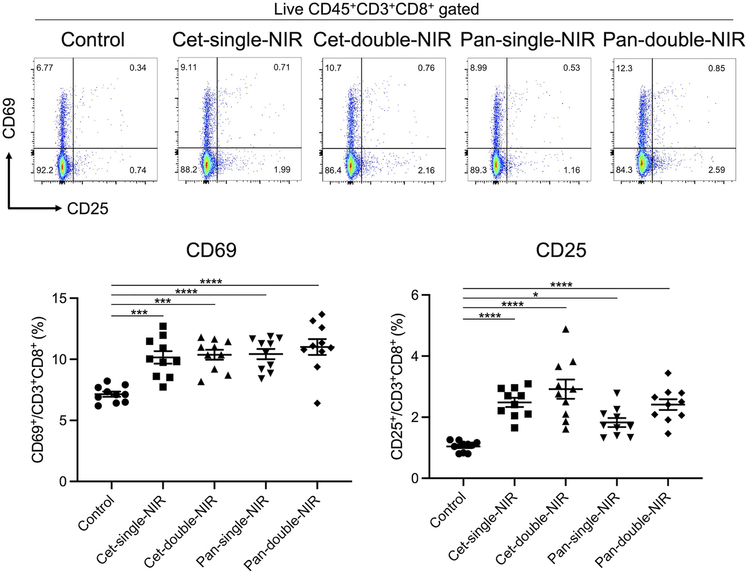
Fig. 4. CD8+ T cell activation within tumor-draining lymph nodes.
CD8+ T cells within tumor-draining lymph nodes were assessed with flow cytometry two days after the initial light exposure. Early phase T cell activation markers, CD69 and CD25, were stained. Scatter plots show representative results of CD69 and CD25 expression on live CD8+ T cells. Dot plots show the CD69 and CD25 positive percentages among CD8+ T cells (n = 10; one-way ANOVA followed by Tukey’s test; *, p < 0.05; ***, p < 0.001; ****, p < 0.0001).

