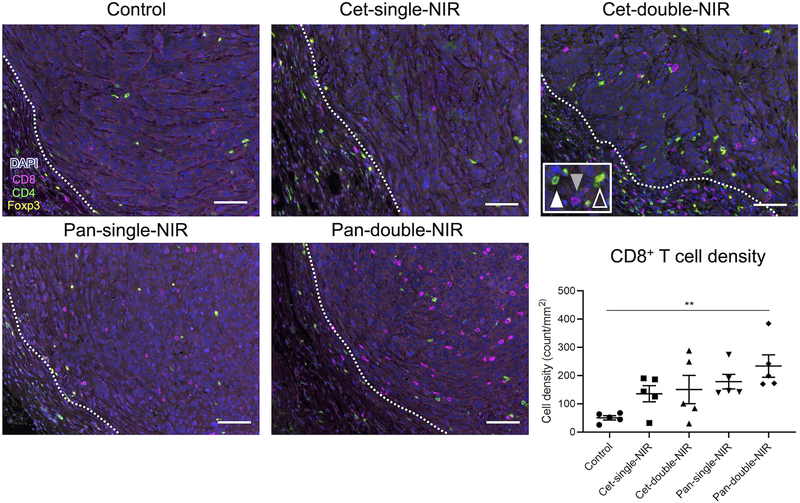
Fig. 5. CD8+ T cell accumulation into tumor.
Tumors were extracted 7 days after the initial light exposure. The specimens were assessed by multiplex IHC staining with anti-pan cytokeratin (pCK; cyan), anti-CD8 (magenta), anti-CD4 (green), anti-Foxp3 (yellow), and DAPI (blue). Photos show representative results of each treatment group. CD8+ cell (gray filled arrowhead), CD4+Foxp3− cell (white filled arrowhead), and CD4+Foxp3+ cell (white open arrowhead) were counted. Scale bar = 100 μm. Dot plots show the intratumoral CD8+ cell density in each experimental group (n = 5; one-way ANOVA followed by Tukey’s test; **, p < 0.01).

