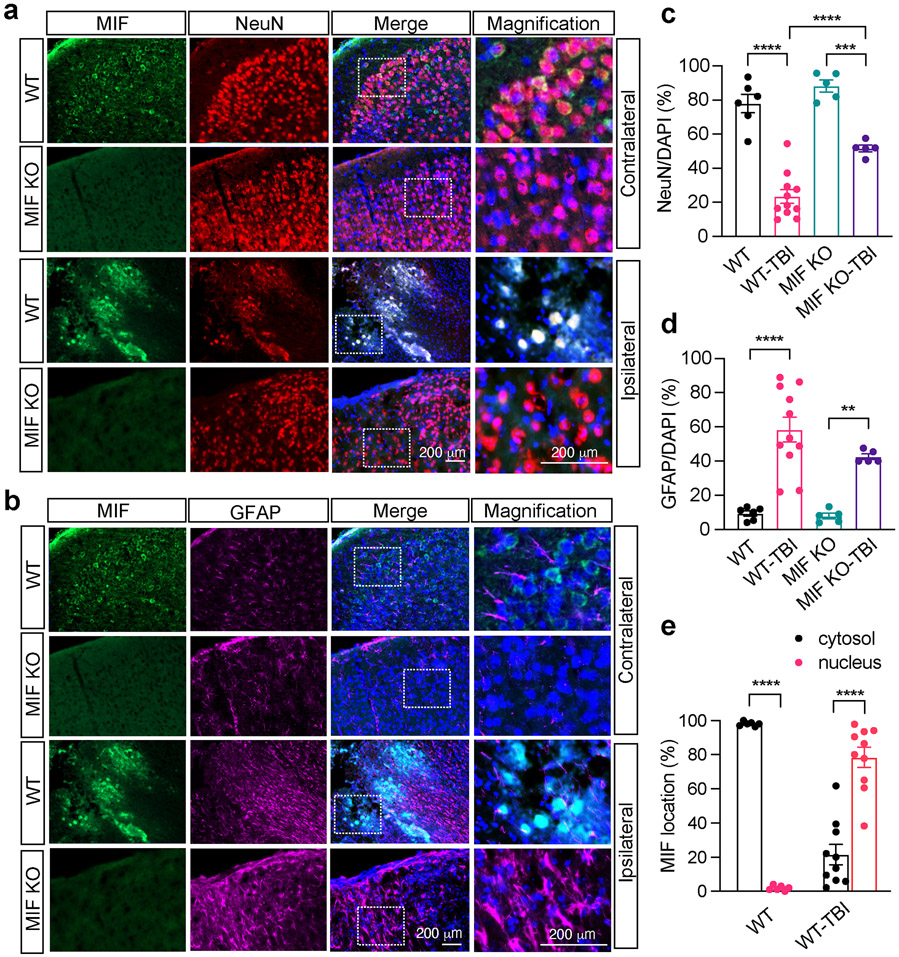
Fig. 3. Expression of MIF in the cortex of mouse brain 1 day after TBI.
a, b. Co-immunostaining of MIF/NeuN (a) and MIF/GFAP (b) in the contralateral (non-TBI) and ipsilateral brain cortex of MIF WT and KO mice next to the damage core 1 day after TBI. c, d Quantification of relative NeuN+ neurons/DAPI per field (c) and GFAP+ astrocytes/DAPI per field (d) in the contralateral (non-TBI) and ipsilateral brain cortex of MIF WT and KO mice 1 day after TBI. Images (n = 6, n = 11, n = 5, n = 5 in order) in the contralateral and ipsilateral sides of WT and KO mice for quantification. e. Quantification of the percentage of MIF localization in the cytosol and nucleus per field in the contralateral (non-TBI) and ipsilateral brain cortex of MIF WT mice 1 day after TBI. Images (n = 6 and n = 10, respectively) in the contralateral and ipsilateral sides of WT mice for quantification. Data in c-e are shown as mean ± SEM and analyzed for statistical significance by one-way ANOVA. **** p < 0.0001, *** p < 0.001, ** p < 0.01.

