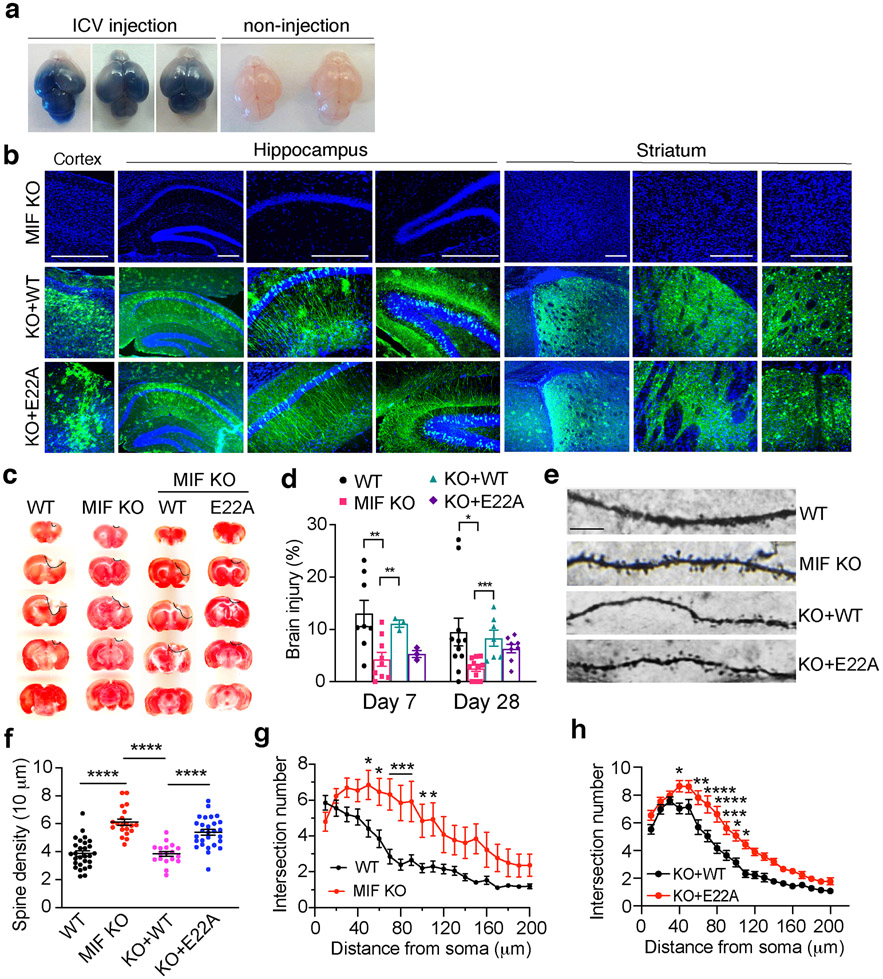
Fig. 7. MIF nuclease activity is required for inducing brain injury and altering dendritic spine density and neuronal morphology following TBI.
a. Representative images of the efficiency and expansion pattern of ICV injection at P0 indicated by trypan blue. 10 mice with ICV injection and 5 mice with non-injection were from 3 independent experiments. b. Representative expression of WT and nuclease-deficient mutant E22A-MIF in cortex, hippocampus and striatum of MIF KO mice 3 months after ICV injection without brain injury. c. TTC staining of MIF WT, KO, and KO mice expressing WT or nuclease-deficient MIF at day 28 post TBI. d. Quantification of TBI-induced injury at day 7 and day 28 in MIF WT (n = 8 and n = 11, respectively), KO (n = 9 and n = 11, respectively), and KO mice expressing WT (n = 3 and n = 7, respectively) or nuclease-deficient E22A MIF (n = 3 and n = 8, respectively). Data are shown as mean ± SEM and analyzed for statistical significance by two-way ANOVA with Sidak’s or Tukey’s multiple comparisons test. *** p < 0.001, ** p < 0.01, * p < 0.05. e. Representative images of dendritic spine in WT, KO, and KO mice expressing WT and nuclease-deficient mutant E22A-MIF at day 28 following TBI. f. Quantification of the spine density in WT, KO, and KO mice expressing WT and nuclease-deficient mutant E22A-MIF at day 28 post TBI. n = 28 (WT); n = 20 (KO); n = 18 (KO+WT); n = 28 (KO+E22A) images. Data are shown as mean ± SEM and analyzed for statistical significance by one-way ANOVA with Sidak’s multiple comparisons test. **** p < 0.0001. g-h. Quantification of the intersection number of neurons in WT (n = 21), KO (n = 15), and KO mice expressing WT (n = 31) and nuclease-deficient mutant E22A-MIF (n = 32) at day 28 post TBI by Sholl analysis. Data are shown as mean ± SEM and analyzed for statistical significance by two-way ANOVA with Sidak’s multiple comparisons test. **** p < 0.0001, *** p < 0.001, ** p < 0.01, * p < 0.05.

