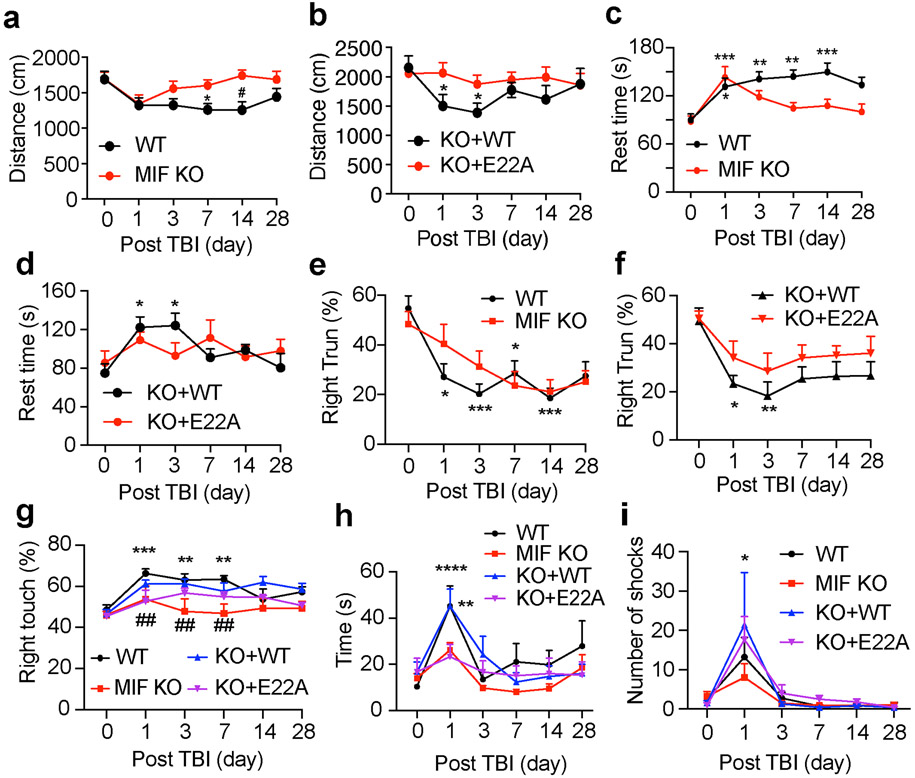
Fig. 8. Loss of MIF or its nuclease activity improved mouse neurobehavioral recovery following TBI.
a-d. Open field test of WT (n = 18), KO (n = 19), and KO mice expressing WT (n = 17) or E22A (n = 15) at day 0, 1, 3, 7, 14 and 28 post TBI. Data are shown as mean ± SEM and analyzed for statistical significance by two-way ANOVA with Tukey’s multiple comparisons test. * p < 0.05 vs. day 0. e-f. Corner test of WT (n = 28), KO (n = 23), and KO mice expressing WT (n = 14) or E22A (n = 14) at day 0, 1, 3, 7, 14 and 28 post TBI. Data are shown as mean ± SEM and analyzed for statistical significance by two-way ANOVA with Tukey’s multiple comparisons test. *** p < 0.001, ** p < 0.01, * p < 0.05 vs. day 0. g. Cylinder test of WT (n = 13), KO (n = 9), and KO mice expressing WT (n = 10) or E22A (n = 14) at day 0, 1, 3, 7, 14 and 28 post TBI. Data are shown as mean ± SEM and analyzed for statistical significance by two-way ANOVA with Tukey’s multiple comparisons test. *** p < 0.001, ** p < 0.01 vs WT at day 0; ##p < 0.01 vs. WT at day 1, 3, 7 post TBI, respectively; h. Beam test of WT (n = 28), KO (n = 27), and KO mice expressing WT (n = 10) or E22A (n = 8) at day 0, 1, 3, 7, 14 and 28 post TBI. Data are shown as mean ± SEM and analyzed for statistical significance by two-way ANOVA with Tukey’s multiple comparisons test. **** p < 0.0001, ** p < 0.01 vs. day 0. i. Treadmill test of WT (n = 33), KO (n = 37), and KO mice expressing WT (n = 9) or E22A (n = 6) at day 0, 1, 3, 7, 14 and 28 post TBI. Data are shown as mean ± SEM and analyzed for statistical significance by two-way ANOVA with Tukey’s multiple comparisons test. * p < 0.05 vs. day 0.

