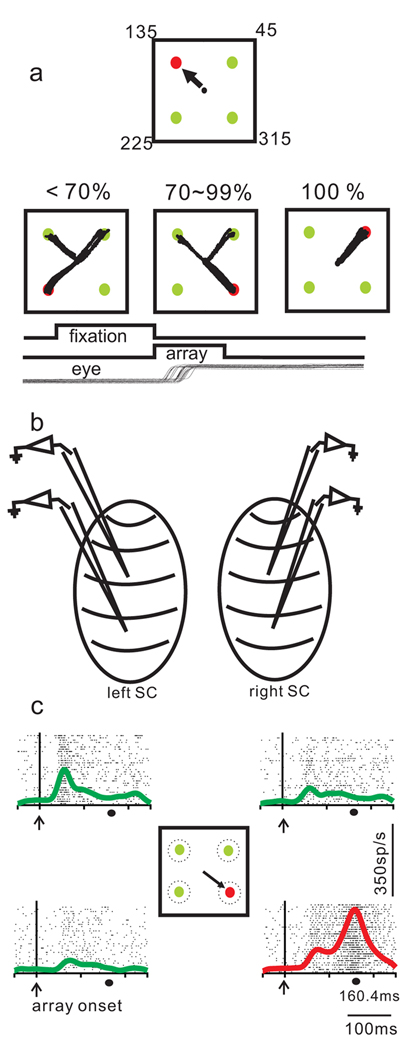
Figure 1.
Saccade choices in a target selection task. a. Each square shows the spatial arrangement of the task. The spot that is colored differently indicates the target whereas the same colored spots indicate distractors (either green among red or red among green). In this example, the target is red. The black circle in the center of each square indicates the location of the fixation spot. In the task, the array appeared and the fixation spot disappeared simultaneously, cueing monkeys to make a saccade to the target (black arrow). The black lines in each of the three bottom squares show actual saccade trajectories. Each of the three squares show examples of choice performance of <70%, 70–99% and 100% correct. Note that all spots were normalized to 45°, 135°, 225° and 315° positions for display. The temporal sequence of the task appears as labeled, black lines below the spatial depiction. b. Schematics of the two SCs and the electrodes for multiple neuron recordings. c. Examples of four neurons recorded simultaneously from the SC. Each tick in a row indicates the time of occurrence of an action potential and each row indicates a trial. The four raster plots correspond to the neurons with RF centers located at the positions shown in the center square. The spike density function (SDF; σ = 10ms) is superimposed on the raster plots. Green lines show SDFs for distractor neurons and red lines show SDFs for target neurons. The mean reaction time of the saccade is shown by the black circle at the bottom of the traces labeled 160.4ms. Each trace is aligned to the onset of the array marked by the upward arrow, vertical line and labeled “array onset”.

