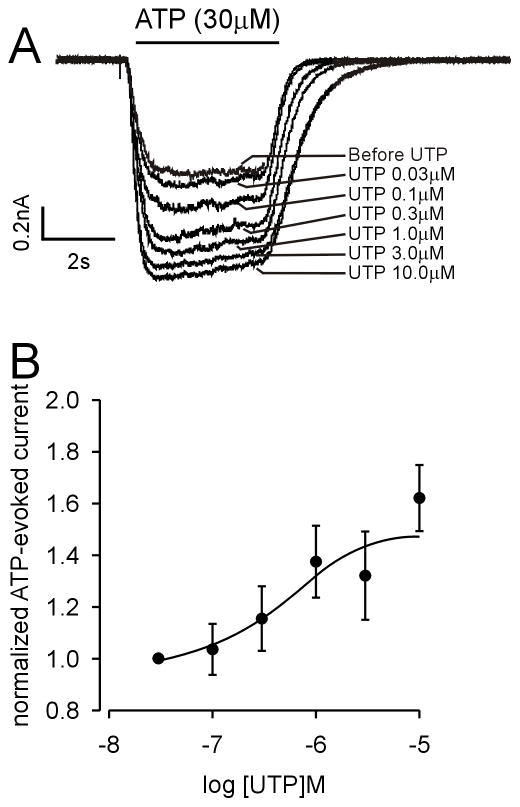
Figure 5.
Dose-response relationship of ATP evoked-sustained currents in response to UTP in lumbosacral bladder neurons. (A) Example of the effect of different concentrations of UTP on the ATP evoked-sustained current. (B) Normalized dose-response curve of ATP evoked-sustained currents in response to UTP. The EC50 and 95% confidence interval for UTP was 0.52 μM (0.13–1.97μM; n=7).

