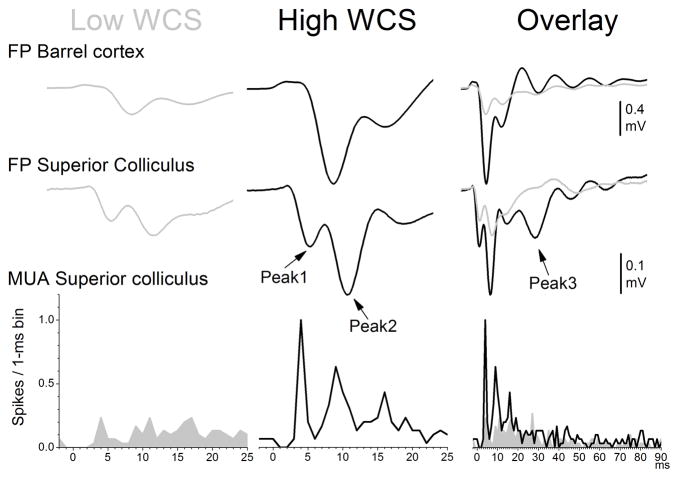
Figure 2.
Representative FP and MUA responses in superior colliculus and barrel cortex to High and Low stimuli. Example of FP responses in barrel cortex and FP and MUA responses in superior colliculus evoked by Low (gray) and High (black) single stimuli. The right panel overlays the responses to High and Low stimuli. Each response is the average of 30 stimulus trials. The arrows point to the peaks of peak1, peak2 and peak3 FP responses in superior colliculus.

