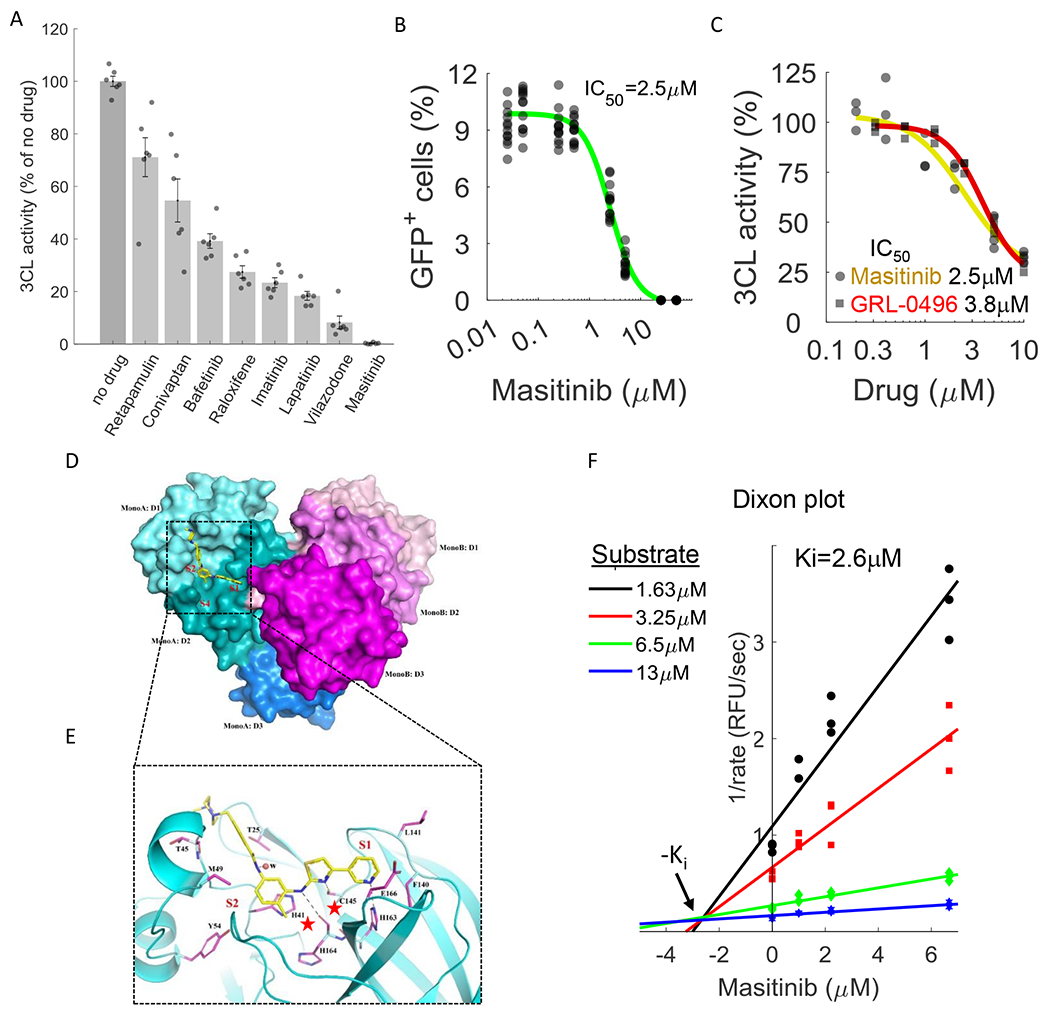
Figure 3. Masitinib inhibits SARS-CoV-2 3CLpro enzymatic activity.

A. A FlipGFP reporter assay was performed to screen for potential inhibition of 3CL by the identified drugs at a single concentration (10μM). Shown are the drugs that showed a statistically significant reduction in 3CLpro activity (p-value<0.05, one-tailed t-test, FDR-corrected). n=6. The data for the remaining tested drugs is shown in Figure S4. Individual measurements are shown in circles. Bars depict mean ± s.e. B. Dose-response curve for 3CL inhibition by masitinib using the FlipGFP reporter assay, n = 6. Individual measurement shown as circles. C. Dose-response curve for 3CL inhibition by masitinib (yellow) and GRL-0496 (red) using a luciferase reporter assay, n = 3. Induvial measurement shown as circles (masitinib) or squares (GRL-0496) D. The dimer formation, domain structure, and masitinib binding site of SARS-CoV-2 3CL. Domains I, II and III (D1-D3) of the monomer A of a 3CL dimer are colored in cyan, teal and light blue, respectively. The corresponding three domains of monomer B are colored in light pink, magenta and purple. In monomer A, masitinib is drawn in stick format, bound to the active site. The location of the three binding pockets S1, S2, and S4 are marked in red. E. A ribbon diagram showing details of some interactions formed between masitinib and 3CL at the active site. Masitinib is drawn in stick format with its C atoms colored in yellow. Key pocket forming or interacting residues of 3CL are also presented in stick format with their C atoms colored in purple. Hydrogen bonds are drawn in black dashed lines. The sites of binding pockets S1 and S2 are marked in red. The two catalytic residues are marked by red stars. F. Dixon plot, showing the rate of 3CL activity in the presence of different substrate and masitinib concentrations. n=3.
