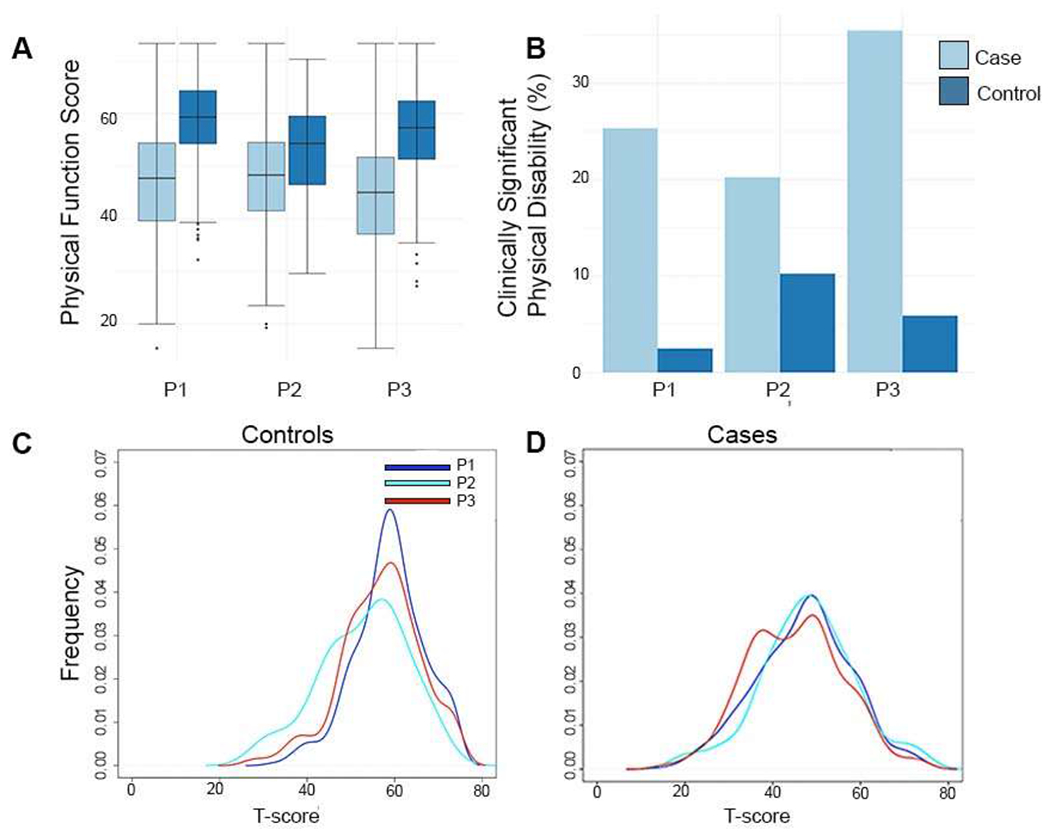
Figure 2.

PROMIS Physical function scores in PwNID and controls during the three periods of the pandemic in 2020: first-wave (P1), trough (P2), and second-wave (P3) pandemic. Lower scores represent higher physical disability. (A) Boxplot represents median/interquartile range. B) Proportion of patients with clinically significant physical disability, defined as PROMIS scores of ≤40. Distributions of physical function scores for controls (C) and PwNID (D) over time.
